
Most of the time, you need to know/navigate what the menu is available and the list of options/ features underneath. Here’s the post just about the User Interface with screenshot on the Power BI Menu and a brief list of options under each. This will help anyone in the Pl-300 exam. Knowing is the beginningContinue reading “User Interface Unveiled: Secrets to Mastering Power BI Desktop (PL-300)”
Tag Archives: Power BI Desktop
All about Prepare data for analysis with Power BI (PL-300)

All about Parameters (PL-300)
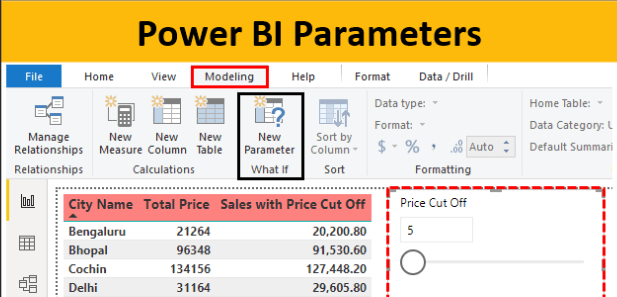
1. A parameter serves as a way to easily store and manage a value that can be reused. 2. Parameters give you the flexibility to dynamically change the output of your queries depending on their value, and can be used for: 3. Power Query provides two easy ways to create parameters: 5. You can alsoContinue reading “All about Parameters (PL-300)”
All types of Average, Max & Min (Statistical DAX)

Average, Max and Min are most commonly used in Excel and it’s quite handy to use this function combined with other calculations. Let’s learn different types of Max, Min & Average DAX functions. MAX() MAXA() MAXX() MIN() MINA() MINX() AVERAGE() AVERAGEA() AVERAGEX() The concept is same for all. MAXX() , MINX() & AVERAGEX() will beContinue reading “All types of Average, Max & Min (Statistical DAX)”
All about Build Power BI visuals and Reports (PL-300)
Key pointers from the MS Learning path for PL-300 Build Power BI visuals and reports 1. Goals while desiging the reports 2. An analyst is a person who provides guidance to the organization. Analysts can be responsible for a range of tasks, often with goals of determining the effectiveness of business strategies, developing or improving processes, orContinue reading “All about Build Power BI visuals and Reports (PL-300)”
A-Z COUNT DAX Functions (Statistical)
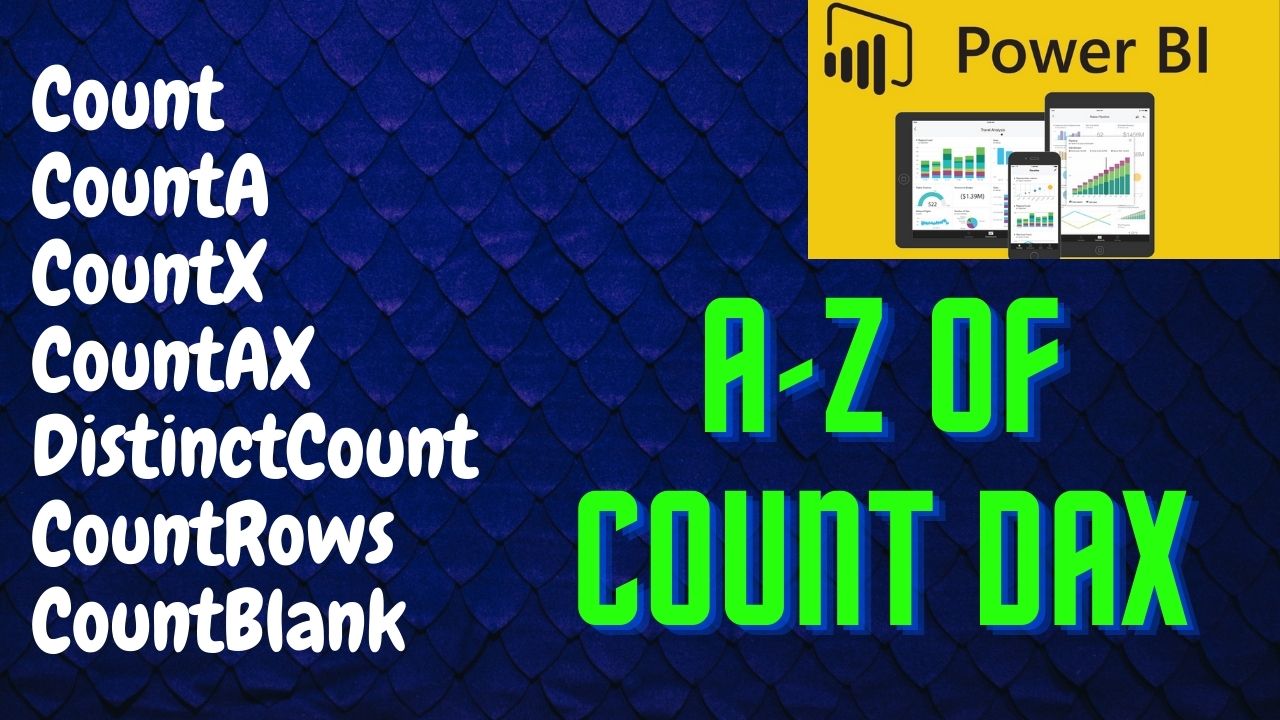
In this post, we are going to learn all the COUNT related DAX fuctions. 1 – COUNT() The COUNT function counts the number of cells in a column that contain numbers. Syntax: COUNT() For example, The following example shows how to count the number of values in the column, ShipDate. COUNT EX = COUNT(InvoiceDetails[InvoiceNumber]) ThisContinue reading “A-Z COUNT DAX Functions (Statistical)”
Calculated Column vs Calculated Measure
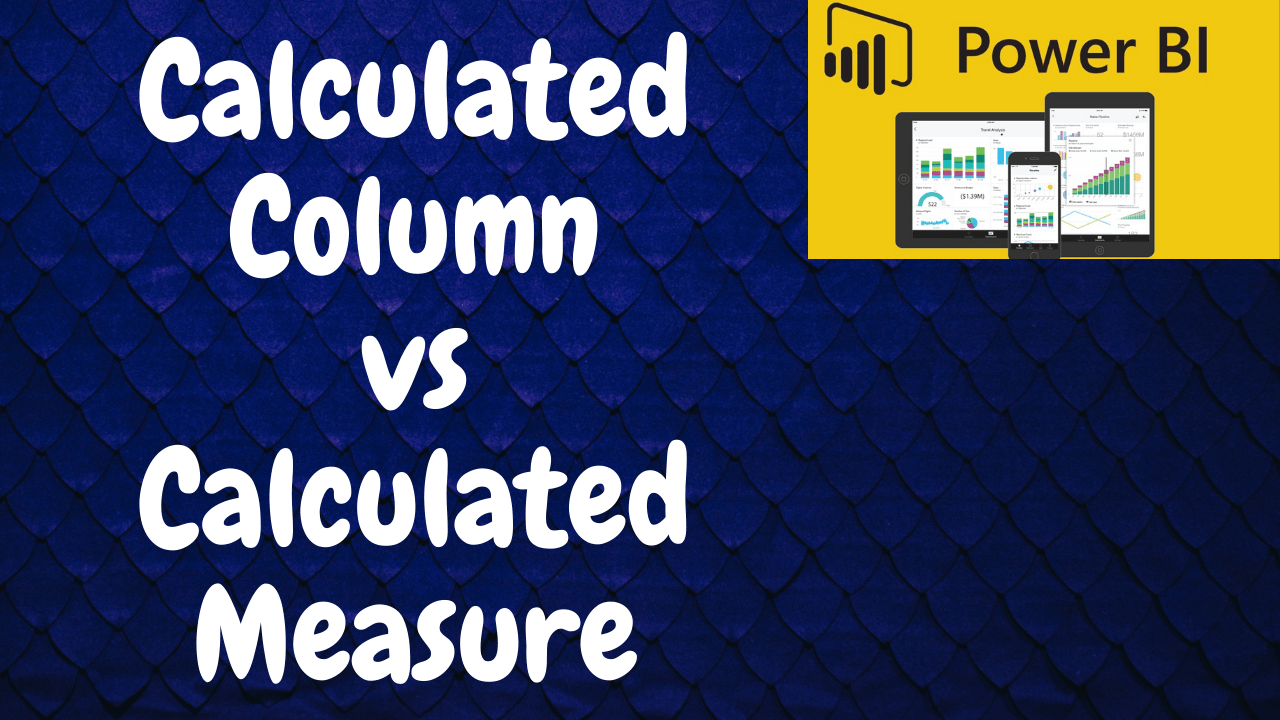
Calculated Column vs Calculated Measure is the most commonly used term in Power BI. Both these features have many roles to play and it is important to understand the difference. You may ask why? Yes, using it appropriately will save you a huge amount of space in your report. If you understand that the mainContinue reading “Calculated Column vs Calculated Measure”
Common Date & Time Functions (DAX)
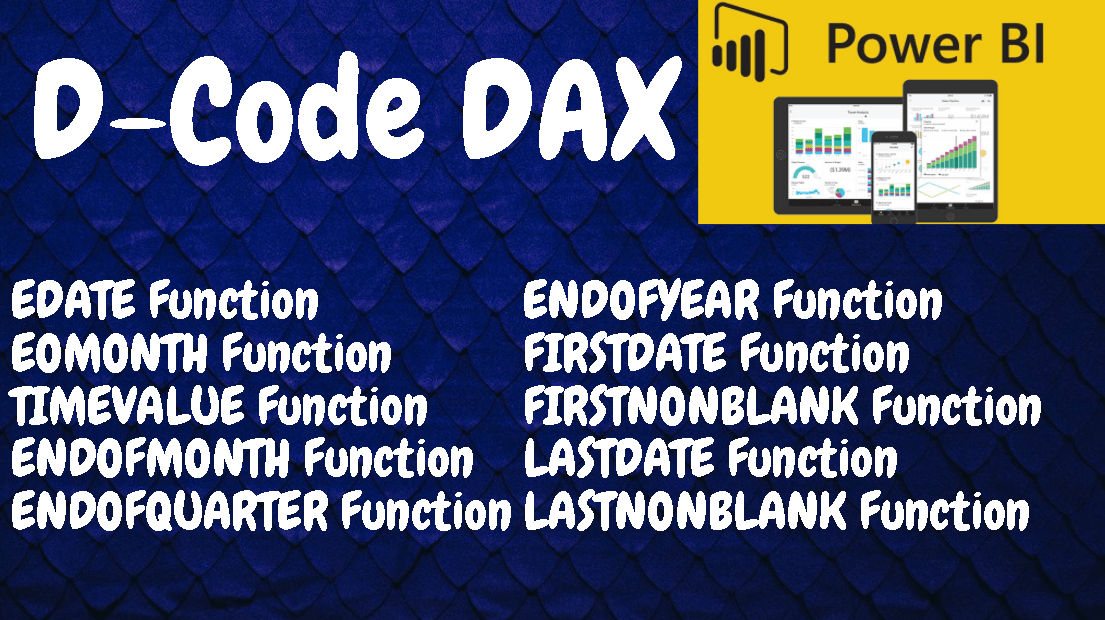
We saw the basic level Date and Time DAX function here. Now, let’s deep dive into some more commonly used Date and Time functions. EDATE Function EOMONTH Function TIMEVALUE Function ENDOFMONTH Function ENDOFQUARTER Function ENDOFYEAR Function FIRSTDATE Function FIRSTNONBLANK Function LASTDATE Function LASTNONBLANK Function EDATE Function: This function returns the date that is the indicatedContinue reading “Common Date & Time Functions (DAX)”
DATEADD vs DATEDIFF vs DATEBETWEEN vs DATESINPERIOD
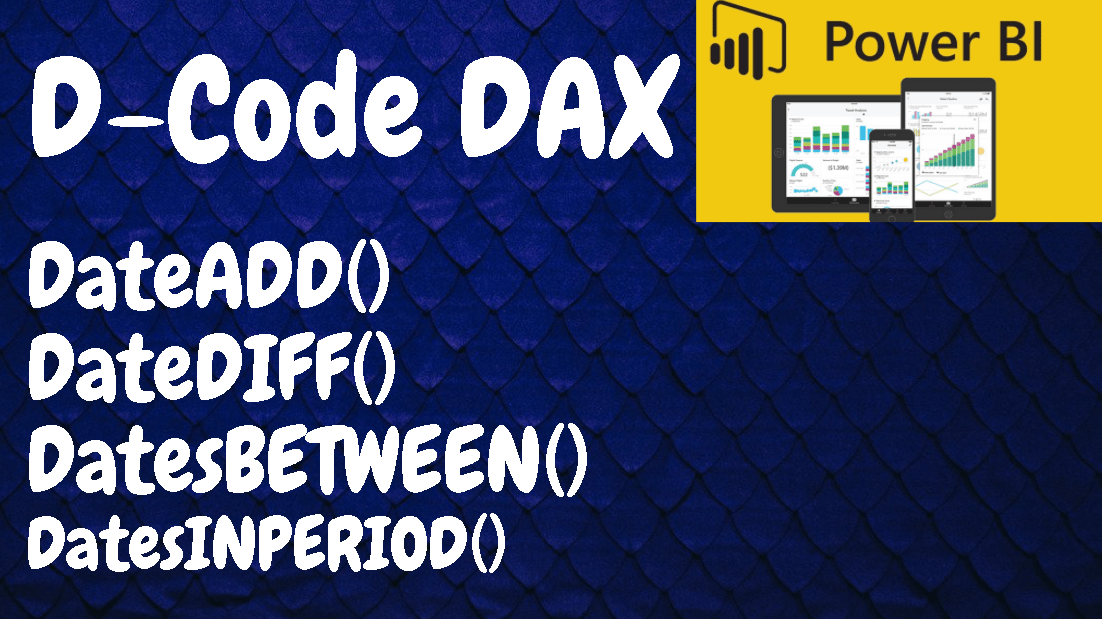
In this post, we are going to learn about the DATEADD, DATEDIFF, DATEBETWEEN, and DATESINPERIOD functions. These functions are very useful when dealing with dates. DATEADD Function (DAX) Definition: Returns a table that contains a column of dates that has been shifted or moved by no of intervals mentioned in the field. The result isContinue reading “DATEADD vs DATEDIFF vs DATEBETWEEN vs DATESINPERIOD”
How to move measure from one table to another in Power BI
Recently, I struggled to move the measures which I have created under wrong table in Power BI. I found an easy solution and here I’m with the post documenting my learnings. The ability to move measures from one table to another table exists in Power BI. The process is simple and much better than re-creatingContinue reading “How to move measure from one table to another in Power BI”
