The filtering functions let you manipulate data context to create dynamic calculations. Today, lets learn about the new filter functions named AllSelected() and AllNoblankrow(). The filter functions in DAX are some of the most complex and powerful, also differ greatly from Excel functions. Check out the post for most commonly used functions All() & AllExcept().Continue reading “AllSelected & AllNoblankRow (DAX)”
Tag Archives: Power BI Desktop
All vs Allexcept
All and Allexcept are useful filter related DAX functions which will help in data analysis many ways. The ALL () Function returns all the rows in a table, or all the values in a column, ignoring any filters that might have been applied whereas ALLEXCEPT() ignores all the filters applied except the one called under parameters.Continue reading “All vs Allexcept”
Sum vs SumX DAX
Lets begin by looking at the difference between the two of the most commonly used DAX function Sum and SumX in Power BI. In Layman words, SUMX is the sum of an expression iterated row by row, but whereas SUM is just summarizing values of one single column. Lets deep dive in detail with examples.Continue reading “Sum vs SumX DAX”
Date and Time Functions (Basic)
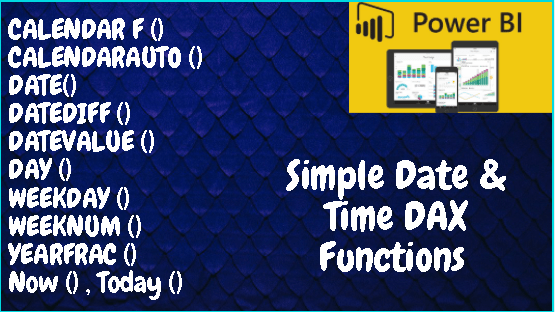
Date and Time Functions (DAX): Just like in MS Excel, there are a lot of similar DAX functions to work with Date and Time-related data in Power BI. They are very useful in many scenarios when dealing with data analysis or while representing dashboards using weeknum, quarter, or yearly data. Let’s explore the basic onesContinue reading “Date and Time Functions (Basic)”
Create Calendar Table in 6 easy steps
You cannot find a dataset without the field “Date”. It can be created date, approved date, ordered date etc. All the data revolves around time. So it is important to create calendar table first as part of your dataset in Power BI. You can use individual Date and Time functions in Power BI or useContinue reading “Create Calendar Table in 6 easy steps”
Row-level security (RLS) with Power BI Desktop
With Power BI Desktop, row-level security (RLS) may be utilized to limit data access for certain users. You can set filters within roles to restrict data access at the row level. Members of a workspace who have access to datasets in the workspace in the Power BI service will not have any impact by RLSContinue reading “Row-level security (RLS) with Power BI Desktop”
All about Cardinality
As we are aware of the fact and dimension table, it’s important to understand the relationship between the tables. It is where the cardinality comes into the picture. Cardinality is the directionality of a relationship, such as one-to-many, one-to-one, and so on. It describes the directionality between fact and dimension tables. Four Types of Cardinality:Continue reading “All about Cardinality”
Fact vs Dimension Table
The first and foremost concept you need to understand in Power BI is the difference between the Fact and Dimension table. Relationships are defined between tables through primary and foreign keys. Relationships between tables are formed when you have primary and foreign keys in common between different tables. Fact Tables (Foreign Key) Dimension Tables (PrimaryContinue reading “Fact vs Dimension Table”
5 Data Modelling Fundamentals
In this post, let’s understand the 5 important Data modeling fundamentals. They are the most important which one should focus as a beginner. If these are not understood enough, I repeat, it is important to get the basics right. Data and lookup tables & Primary and foreign keys Relantionship Cardinality Filter Flow Evaluation Context CommonContinue reading “5 Data Modelling Fundamentals”
How to Set Up Power BI Gateway
As you know, Power BI allows to connect various sources of data. One such data source is On premises data. It is important to configure the data gateway to enable the schedule refresh and stay updated with dashboard. Let’s recap the common sources of data import in Power BI as listed below: Sources of DataContinue reading “How to Set Up Power BI Gateway”
