
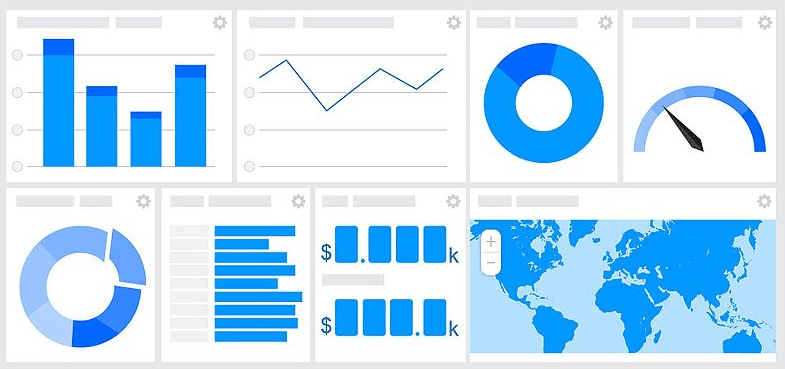
Creating an effective Power BI dashboard requires careful planning and a keen eye for detail. Whether you’re a seasoned pro or new to dashboard creation, ensuring your dashboards include certain essential elements can significantly enhance their effectiveness and usability. Let’s explore these key components. 1. Clear and Concise Titles for each Visualisation I used toContinue reading “Does your Power BI Dashboard has these 25 Elements?”
Tag Archives: Dashboards
Color Palettes for Power BI: Best Practices

In this blog post, we’ll dive into how to choose colors wisely for your Power BI dashboards. We’ll explore why colors matter, how they affect our brains, and practical tips to make your dashboards not just informative, but visually compelling
45+ Types of Data Visualization
“Data is the new oil”. Yes, Michael Palmer expanded on Humby’s quote by saying, like oil, data is “valuable, but if unrefined it cannot really be used. Data Visualization In the era of digital technology, more and more data piles up. Being in PMO, you get your hands on with data every day to measure the performanceContinue reading “45+ Types of Data Visualization”
3 Use Cases of Row Level Security (RLS)

Recently I learned about three use cases of RLS and I couldn’t journal about it. I have written a post on RLS which contains the basic information that you need to understand the concept. In this post, let’s go ahead with understanding those three use cases of RLS. Three Use Cases of RLS Row-level securityContinue reading “3 Use Cases of Row Level Security (RLS)”
User Interface of Power BI Service (PL-300)

When you learn any tool, it is foremost important to know the user interface of the tool. It will help you in many ways as listed below. This is my personal experience of learning. Here’s the post with just detailing the complete user interface of the Power BI Service. This post helped to know many hiddenContinue reading “User Interface of Power BI Service (PL-300)”
10 Smartsheet Tips and Tricks

When you learn any tool, always look for contents related to Tips & Tricks. This lets you to understand the tool features & functionally in detail, know the shortcuts which in turn improves the productivity. This also covers the gaps in learning the small elements that you missed in the structured learning in terms ofContinue reading “10 Smartsheet Tips and Tricks”
Online Dashboard Project
First project is always a special and close for someone. Similarly, I also had my first experience working in real-time Software Development Project. I really enjoyed working in the project and had tremendous learning experience. Here’s some details about the project. We adopted the agile methodology of Plan, Design, Develop, Test & Release cycle duringContinue reading “Online Dashboard Project”
OKR vs KPI – Outcome vs Output
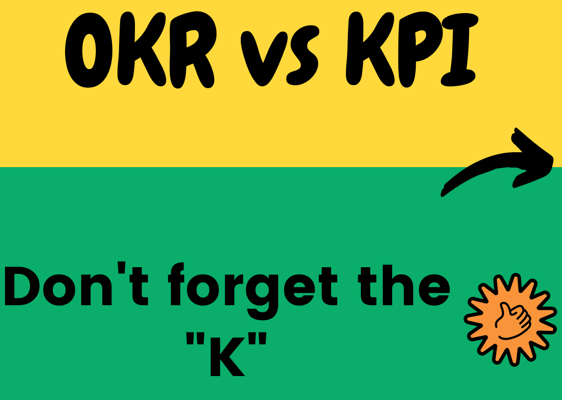
I recently got acquainted on the word OKR – Objectives & Key Results. My thirst for the learning made to dig drive to understand what is all about OKR and its comparison to KPI – Key Performance Index. KPIs are typically the Outputs whereas the OKR will showcase the outcomes because of the KPI. OutcomesContinue reading “OKR vs KPI – Outcome vs Output”
Functionality of Smartsheet
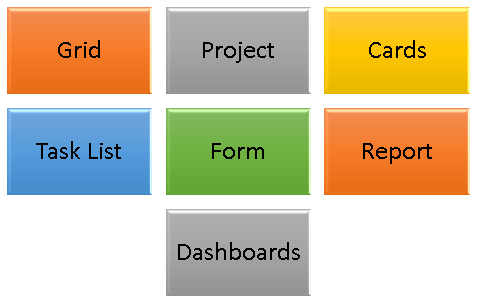
Let’s see about the features and functionality in this post. Don’t forget to checkout my other posts on Smartsheet here. There are 7 major elements in Smartsheet and lets see one by one in detail. 1. Grid—Has no predefined columns except for default columns—it’s a clean slate. Use this when you want to start fromContinue reading “Functionality of Smartsheet”
Are you aware of Different Views in Smartsheet
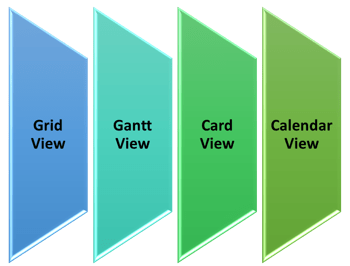
The most significant feature in the Smartsheet is the ability to view the sheets of Rows and Columns (Grid view) in three different forms – Cards , Gantt & Calendar view. Let’s see in detail. This post gives the overall features and functionality in each views. Don’t forget to checkout my other posts on SmartsheetContinue reading “Are you aware of Different Views in Smartsheet”
