Lets begin by looking at the difference between the two of the most commonly used DAX function Sum and SumX in Power BI.
In Layman words, SUMX is the sum of an expression iterated row by row, but whereas SUM is just summarizing values of one single column.
Lets deep dive in detail with examples.
| Sum | SumX |
|---|---|
| This is called as Aggregation. It adds up all the values in a single column you specify after applying all filters that will impact the formula. It can’t do row by row evaluation | This is called Iterator as the function is looping through all rows in the input table and storing the expression result in a temporary memory storage. This eliminates the Total sum error which may occur while using Sum function. |
| This function is similar to other Aggregators like Average, Min, Max, Count. | Other iterator functions are: AverageX, MinX, MAXX, CountaX, etc. |
| Syntax: SUM (<column>) | Syntax: SUMX (<table>, <expression>) |
Sum DAX Function:
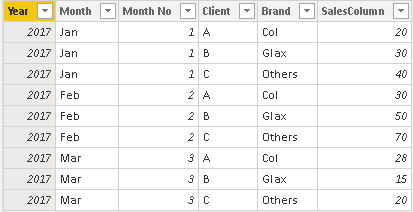
Below is the sample Table. Lets calculate the sum of sale column.
Sum of Sales = SUM('Table'[SalesColumn])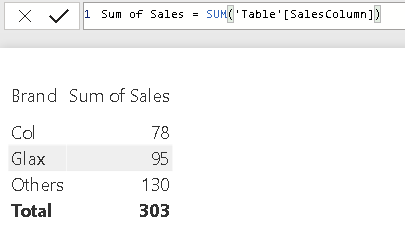
Now we have cost table as below:
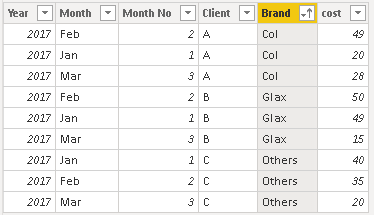
Lets calculate the sum of cost as below.
Sum of cost = SUM(Cost[cost])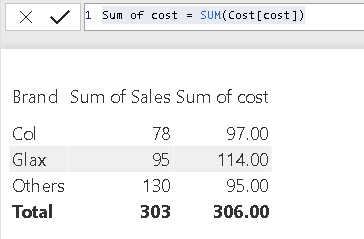
Sumx DAX Function:
Now, lets find the Margin by using the Sumx function. While using the Sumx function, we are first selecting the table name “sale” and Cost” and then corresponding field which you want as expression for finding the margin.
Margin = SUMX(Sale,Sale[Sum of Sales])-SUMX(Cost,Cost[Cost])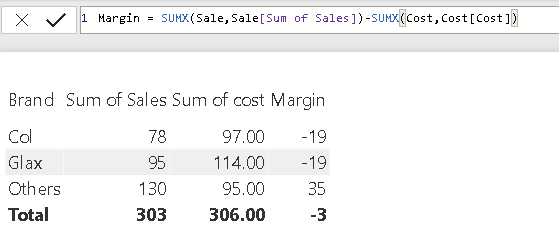
Use of “If” DAX function with SUMX:
You can also combine If function with Sumx, to find the value based on a condition. The below code calculates the sum of sales only if the brand is “col”.
Sales if brand is Col = Sumx(Sale,IF(Sale[Brand]="Col",[Sum of Sales]))
Use of “All” DAX function with SUMX:
Using All function along with Sumx has more advantage as it’s name suggests, returns all the rows in a table, or all the values in a column, clearing all the filters, say if you want to find the Total sales & Total cost to calculate the % of sales & cost in each Brand, lets write the code as below.
The main advantage is if I have used slicer in the visualization, the Total sales will still show sum of all the sales.
ALL( [<table> | <column>[, <column>[, <column>[,…]]]] )
The table that you want to clear filters on.
The column that you want to clear filters on.
Total Sales = SUMX(ALL(Sale), [Sum of Sales])Now, I can calculate the % of sales & cost in each Brand.
% of Sales = DIVIDE([Sum of Sales],[Total Sales])Compare the two tables below, the total sales is 303 whereas in the second table, even when I applied slicer, the value remains the same.


There are functions like Filter, Related, All & Allexcept can be used along with Sumx to filter and calculate the values. Check out the DAX archives.
Hope you found the post informative. Your valuable feedback, question, or comments about this post are always welcome by leaving me message on contact form is truly appreciated.
Discover more from LR Virtual Classroom
Subscribe to get the latest posts sent to your email.
