Calculated Column vs Calculated Measure is the most commonly used term in Power BI.
Both these features have many roles to play and it is important to understand the difference.
You may ask why? Yes, using it appropriately will save you a huge amount of space in your report.
If you understand that the main difference lies only in the way how it is evaluated.
The differences between them are subtle but significant.
- Use a calculated column when you want to evaluate each row
- Use a measure when you need an aggregate
Choosing the wrong one can result in anything from poor report performance to incorrect results.

Calculated Column
Let’s learn about the calculated column which is the easiest of all.
They are very similar to regular columns that you have in excel data sets. You can perform row-level calculations. Say you want to find the Margin for every row based on the budget and the actuals.
It simply calculates the margin in every row entry and you can use pivot to aggregate the data.
When to Use Calculated Column:
You can use the calculated column for
- To do the row-level calculation, just like the pre-calculated field based on other columns in EVERY row.
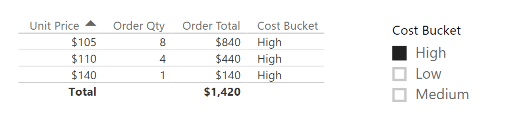
- To use as a report filter
- To use a slicer
- To use in a pivot chart
- To have data refreshed in every source refresh
- To use for relationship mapping
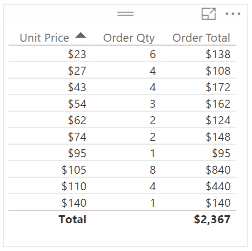
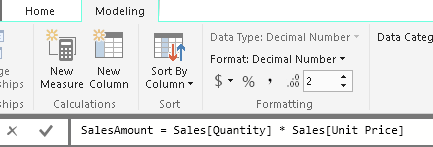
For example, Order Total = ]unit Price]*[Order Qty] is a row-level calculation in each row.
Storage & Performance Perspective of Calculated Column
With calculated columns, you can add new data to a table already in your model.
You can use the data to classify items as low, medium, or high priced in the above example.
It calculates very quickly every time the data source changes.
so in a performance perspective, it runs very quickly as it is updated at the same time as the data source query.
The main downside is that calculated columns take up more storage in your database as it adds more data to the existing database.
Calculated Measure
Measures are used to calculate aggregates, such as the sum or average of a column.
As you know, the calculated column executes at every row level, whereas calculated measures are only evaluated at the level of granularity they are plotted at.
The KPI metrics that you use in your reports are always based on calculated measures.
Without an aggregation function, the measure’s formula will display an error.
Although you can use a calculated column to reference a measured value. For example, Column1= <measure name.
But remember use this only if it is required else you can use measure directly.
When to Use Calculated Measure
- Measures cannot be used as filters in a slicer nor as filters at page and report levels. So use calculated columns instead.
- Use calculated measure if to change value anytime the context changes.
- For example, If I want the sales person’s percentage of sales to change for the selected region, it needs to be recalculated based on the total sales per region. The measure will calculate each time the user selects another region in the slicer.
Storage & Performance Perspective of Calculated Column
Measures are calculated at the time of your query, which means that they aren’t stored in your database.
If you change a date filter from 2019 to 2020, all the measures will be calculated again.
So processing power perspective, it executes a query at the time of your request.
Because measures are not stored in memory, they are generally faster.
Depending on the tradeoff between utilizing in-memory storage or processing power that you need on your report, you can use either a measure or a calculated column.
Discover more from LR Virtual Classroom
Subscribe to get the latest posts sent to your email.
