
If you’re loving Power BI and want to kick your reports up a notch, you’re in for a treat! Some awesome external tools out there can make your Power BI experience even better. These tools give you cool stuff like custom themes, fancy charts, and handy helpers for writing formulas (called DAX).
Here’s the link from Microsoft Learn Site
In this blog post, we’re diving into these tools. Whether you’re a pro or just starting out, they’re like magic tricks for making your reports look amazing and work even smarter.
We’ll walk through each one, sharing easy tips so you can use them like a pro and impress everyone with your data skills.
Ready to make your Power BI reports shine? Let’s explore how these tools can make your data storytelling awesome!
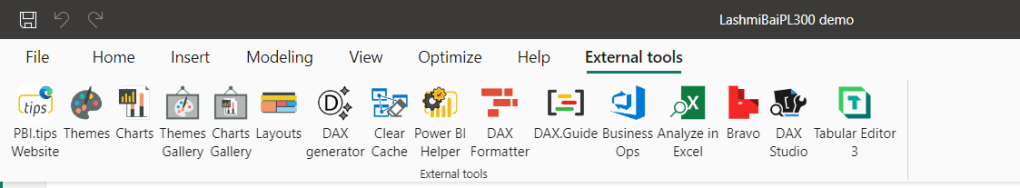
Power BI Tips
Themes and Charts:
Layouts and Customization Tools
Performance and Maintenance Tools:
Business Operations Tools:
Advanced Development Tools:
1. Themes
Definition and Features:
Themes in Power BI allow you to apply consistent formatting across your reports, including colors, fonts, and visual styles. They ensure a unified look and feel throughout your dashboards and reports.
Advantage:
By using themes, you can maintain brand consistency, improve report readability, and enhance user experience by presenting data in a visually appealing manner.
Link to Download:
Themes are built into Power BI Desktop. Learn more about creating and applying themes here.
2. Charts
Definition and Features:
Charts in Power BI provide various visualization types such as bar charts, line graphs, pie charts, and more. They help to visually represent data trends, comparisons, and patterns.
Advantage:
Using the right charts can make complex data easier to understand at a glance, enabling stakeholders to derive insights quickly and make informed decisions.
Link to Download:
Charts are an integral part of Power BI Desktop. Explore different chart types and how to use them effectively here.
3. Layouts
Definition and Features:
Layouts in Power BI refer to the arrangement and organization of visuals, filters, and other elements within a report or dashboard. They help in designing intuitive and user-friendly interfaces.
Advantage:
Effective layouts enhance user navigation, highlight key insights, and improve overall report usability, ensuring that information is presented logically and accessibly.
Link to Download:
Layout customization is done within Power BI Desktop. Learn more about designing effective layouts here.
4. DAX Generator
Definition and Features:
DAX Generator simplifies the process of writing DAX (Data Analysis Expressions) formulas by generating code snippets based on specific criteria or inputs. It aids in developing complex calculations efficiently.
Advantage:
It accelerates DAX formula development, reduces errors, and supports consistent application of DAX best practices, thereby enhancing productivity and accuracy in report creation.
Link to Download:
Explore DAX Generator and its capabilities at DAXGenerator.com or similar developer resources.
5. Clear Cache
Definition and Features:
Clear Cache is a feature in Power BI that allows users to refresh and clear cached data, ensuring that reports reflect the most up-to-date information from data sources.
Advantage:
By clearing the cache, users can avoid displaying outdated data in reports, ensuring accuracy and reliability in decision-making processes based on real-time insights.
Link to Download:
Clear Cache functionality is integrated into Power BI Desktop and Service. Learn how to clear cache in Power BI Desktop here.
6. Power BI Helper
Definition and Features:
Power BI Helper is a toolset that assists in optimizing Power BI reports and models. It provides insights into dependencies, performance bottlenecks, unused items, and best practices for report development.
Advantage:
It helps in improving report performance, reducing file size, and enhancing overall efficiency in Power BI development and maintenance tasks.
Link to Download:
Explore Power BI Helper features and download it from PowerBI.tips or similar resources for Power BI tools and add-ins.
7. DAX Formatter
Definition and Features:
DAX Formatter is a tool that formats DAX formulas for improved readability and structure. It automatically organizes DAX code, adds line breaks, and highlights syntax to make complex formulas easier to understand and troubleshoot.
Advantage:
It enhances productivity by ensuring DAX code is well-organized and easy to maintain, reducing errors and speeding up formula development.
Link to Download:
Access the DAX Formatter tool and learn more about its features at DAXFormatter.com or similar developer tools platforms.
8. DAX Guide
Definition and Features:
DAX Guide is a comprehensive reference tool for understanding DAX functions, syntax, and examples. It provides detailed explanations and usage scenarios for each DAX function.
Advantage:
It serves as a valuable resource for learning DAX, improving proficiency in writing DAX formulas, and leveraging advanced analytical capabilities in Power BI.
Link to Download:
Explore the DAX Guide and its resources at DAX.Guide or similar platforms dedicated to DAX functions and tutorials.
9. Business Ops
Definition and Features:
Business Ops tools in Power BI facilitate operational analytics and reporting, focusing on key performance indicators (KPIs), business processes, and workflow optimizations.
Advantage:
They enable organizations to monitor and analyze operational metrics in real-time, identify trends, and make data-driven decisions to improve efficiency and productivity.
Link to Download:
Explore Business Ops capabilities within Power BI and learn how to integrate operational analytics into your reports and dashboards – https://powerbi.tips/2022/02/business-ops-3-0-2-updated-external-tools/
10. Analyze in Excel
Definition and Features:
Analyze in Excel allows users to connect Power BI datasets directly to Excel for deeper analysis and reporting capabilities. It enables users to leverage Excel’s familiar interface and powerful data manipulation features.
Advantage:
It enhances data exploration and reporting flexibility by combining Power BI’s data modeling capabilities with Excel’s advanced analytics and visualization tools.
Link to Download:
Learn how to use Analyze in Excel and integrate it with Power BI datasets here.
11. Bravo
Definition and Features:
Bravo is a tool that enhances Power BI report development with advanced formatting options, interactive features, and customizable visuals. It helps in creating engaging and interactive dashboards.
Advantage:
It empowers users to design visually appealing reports, improve user interaction, and present data in innovative ways that captivate stakeholders and enhance decision-making.
Link to Download:
Explore Bravo’s features and download it for Power BI customization and visualization enhancements here https://bravo.bi/
12. Tabular Editor 3
Definition and Features:
Tabular Editor 3 is a lightweight editor for managing Power BI models and Analysis Services Tabular models. It provides a user-friendly interface for metadata management, calculations, and relationships.
Advantage:
It streamlines model development and maintenance tasks with advanced scripting, version control, and bulk editing capabilities, essential for managing complex data models efficiently.
Link to Download:
Download Tabular Editor 3 and explore its features at TabularEditor from developer platforms specializing in Power BI tools.
13. Report Analyzer
Definition and Features:
Report Analyzer is a tool designed to help you analyze and optimize your Power BI reports. It provides detailed insights into report performance, including load times, data refresh rates, and visualization rendering speeds. The tool helps identify performance bottlenecks, inefficient queries, and heavy visuals that may slow down your reports.
Advantage:
Using Report Analyzer, you can significantly improve the performance and efficiency of your Power BI reports. It allows you to make data-driven decisions about optimizing your reports, ensuring they run smoothly and deliver a seamless experience for end users. By identifying and addressing performance issues, you can enhance user satisfaction and improve the overall effectiveness of your reports.
Link to Download:
Explore Report Analyzer features and download it from Report Analyzer https://www.elegantbi.com/post/reportanalyzer
Thats a wrap 🙂
Discover more from LR Virtual Classroom
Subscribe to get the latest posts sent to your email.
