
In this blog post, I will share some of the advanced DAX concepts I have utilized during my Power BI dashboard development project. These techniques have enabled me to create sophisticated and dynamic reports, enhancing the overall analytical capabilities of my dashboards.
Whether you are looking to calculate unique counts under specific conditions, identify duplicates, or format data for better visualization, these DAX formulas can significantly improve your Power BI skills and project outcomes.
List of Headings
- Calculating the Last Refreshed Date
- Creating Ageing Conditions
- Adding Tooltips in Power BI
- Finding Ageing for Specific Conditions/Status
- Calculating Ageing in Weeks
- Converting Ageing to Categories
- Ordering Categories in Charts
- Counting Retired/Revoked DMs
- Formatting Created Date as Month (MMM)
- Finding Duplicate DM Count
- Finding Unique Count of Published DMs
- Extracting Year from Date
- Creating Fiscal Year (FY) Formats
- Finding Quarter from Date
- Creating Quarter Format (Q1, Q2, etc.)
- Creating Custom Quarter Format (e.g., Q1-Jul, Q1-Aug)
- Calculating Inactive Aging in Power BI
- Streamlining Status Representation in Power BI
- Defining and Implementing Custom Status Sorting in Power BI
Last Refreshed Time
DAX:
Last Refreshed =
var a = VALUES(LastRefreshed[LastRefreshedDateIST]) - datetime.now()
return "Refreshed Data as of " & a & " IST"
DAX Function Breakdown:
var a = VALUES(LastRefreshed[LastRefreshedDateIST]): This assigns the distinct value of the last refresh date from the specified column to variablea.return "Refreshed Data as of " & a & " IST": This returns a string that combines the text with the value ofa, indicating the last refresh date and time in IST.
PMO Usage:
Displaying the last refresh date ensures data transparency and helps stakeholders verify they are using the latest data. It aids in monitoring data refresh schedules and maintaining data integrity.
Output:
For example, it would display “Refreshed Data as of 07/05/2024 10:00 AM IST”, clearly showing the last data refresh time.
Tooltips
DAX:
Ageing Condition = If Ageing is less than 8 weeks then 🟢 If between 8-10 weeks then 🟡 If more than 10 weeks then 🔴
DAX Function Breakdown:
- Condition for Green: If the ageing is less than 8 weeks, display a green circle.
- Condition for Yellow: If the ageing is between 8-10 weeks, display a yellow circle.
- Condition for Red: If the ageing is more than 10 weeks, display a red circle.
PMO Usage:
This function visually categorizes project tasks based on their ageing, making it easier for PMOs to prioritize and manage tasks efficiently.
How to add Tooltip?
- Select the visual in Power BI that you want to add a tooltip to.
- Click on the “Format” tab in the Visualizations pane.
- Click on “Tooltip” in the “Formatting” section.
- Enter the text or visual elements you want to include in the tooltip.
- Save the tooltip settings and preview the visualization to see the tooltip in action.
How to find the Aging only for specific Condition/Status:
DAX Function Breakdown:
- Condition Check: If the
statusis “Published”, “Upgraded”, “Revoked”, or “Rejected”, setAgingto 0. - Calculate Aging: Otherwise, calculate the absolute difference in days between the
Created dateand the current date.
PMO Usage:
This DAX function calculates the aging of tasks based on their status, helping PMOs focus on tasks that are not yet completed or resolved.
Example in Power BI:
Aging =
IF (
    Table[status] = "Published" ||
    Table[status] = "Upgraded" ||
    Table[status] = "Revoked" ||
    Table[status] = "Rejected",
    0,
    ABS(DATEDIFF(Table[Created date], NOW(), DAY))
)
Output:
For example, tasks with the status “Published”, “Upgraded”, “Revoked”, or “Rejected” will have an aging of 0, while other tasks will show the number of days since they were created.
Agin in Weeks
DAX Function Breakdown:
- Convert Days to Weeks: Divide the
Agingin days by 7 to convert it to weeks. - Round Down: Use the
ROUNDDOWNfunction to round down to the nearest whole number.
PMO Usage:
This function helps PMOs track the age of tasks in weeks, providing a more meaningful time frame for project management and reporting.
Example in Power BI:
Aging in weeks =
ROUNDDOWN(DIVIDE(Table[Aging], 7), 0)
Output:
For example, if a task’s Aging is 15 days, the Aging in weeks would be 2 weeks, making it easier to understand and manage the age of tasks.
How to convert the Aging to Category
Got it! Let’s create the category table and then use a DAX function to categorize the aging.
Creating the Aging Category Table
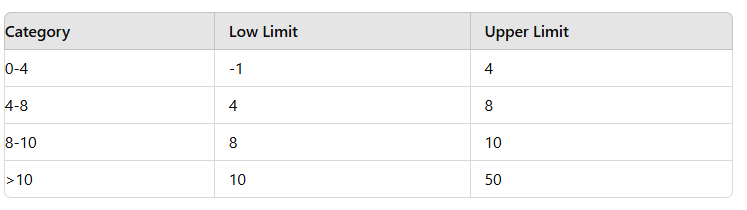
- Enter Data:
- Go to
Home>Enter Data. - Enter the following data: Category Low Limit Upper Limit 0-4 -1 4 4-8 4 8 8-10 8 10 >10 10 50
- Name the table
AgingCategory.
DAX Formula to Categorize Aging
- Ensure
Aging in weeksMeasure Exists:
- Create the measure if not already created:
Aging in weeks = ROUNDDOWN(DIVIDE(Table[Aging], 7), 0)
- Create the Aging Category Measure:
- Use the following DAX formula to categorize the aging:
Category = VAR CatVar = [Aging in weeks] RETURN CALCULATE ( VALUES (AgingCategory[Category]), CatVar >= AgingCategory[Low Limit], CatVar < AgingCategory[Upper Limit] )
Output
For example, if a task’s Aging in weeks is 5 weeks, the Category would be “4-8”, helping PMOs quickly identify the age category of tasks for better prioritization and management.
How to show the category in order while using in Charts:
To display the category in a specific order while using it in charts, you can create a Category Index measure using the SWITCH function in DAX. This measure assigns a numerical index to each category based on its logical order, which can then be used for sorting purposes in visuals like charts. Here’s how you can set it up:
Creating the Category Index Measure
Ensure Category Measure Exists:
- Make sure you have a measure named
Categorythat categorizes your data based on the age ranges as per your previous setup.
Create the Category Index Measure:
- Use the following DAX formula to assign an index to each category:
Category Index = SWITCH ( TRUE (), MAX(Table[Category]) = "0-4", 1, MAX(Table[Category]) = "4-8", 2, MAX(Table[Category]) = "8-10", 3, MAX(Table[Category]) = ">10", 4 )
Using Category Index in Charts
Once you have the Category Index measure, you can use it in your charts to ensure the categories are displayed in the correct order:
Add Category and Category Index to Visuals
- Add your categorical data (e.g., tasks) to the axis or legend of your chart.
- Add
Category Indexto the sorting options for the axis or legend to ensure the categories are displayed in the desired order.
Sort by Category Index:
- In the visualization settings (e.g., Format pane in Power BI), find the sorting options for your categorical axis or legend.
- Choose to sort by
Category Indexin ascending or descending order, depending on how you want the categories to appear.
Example Usage
For example, if your data includes tasks categorized as “0-4 weeks”, “4-8 weeks”, “8-10 weeks”, and “>10 weeks”, the Category Index measure will assign values 1 through 4 respectively. This ensures that when displayed in a chart, the categories will appear in the logical order defined by their age ranges.
Display Count in Text – Multiple If Condition with AND OR Operator:
DAX Formula to Display the Count of CM
First, let’s create a DAX measure that counts the rows based on specific conditions and then concatenates this count into a text string.

The conditions specified are:
requesttypeequals “Build”Platformequals “Component”Statusis not “Request rejected”Statusis not “Retired”
Step-by-Step Breakdown
- Create the Count Measure:
- Use the
VARstatement to define the variableawhich stores the count of rows meeting the specified conditions. - Use the
IFandISBLANKfunctions to handle cases where the count might be blank.
- Concatenate the Count into Text:
- Use the
RETURNstatement to concatenate the count into a text string.
Example in Power BI
Count of CM =
VAR a = IF (
    ISBLANK (
        COUNTROWS (
            FILTER (
                Table,
                Table[requesttype] = "Build" &&
                Table[Platform] = "Component" &&
                Table[Status] <> "Request rejected" &&
                Table[Status] <> "Retired"
            )
        )
    ),
    0,
    COUNTROWS (
        FILTER (
            Table,
            Table[requesttype] = "Build" &&
            Table[Platform] = "Component" &&
            Table[Status] <> "Request rejected" &&
            Table[Status] <> "Retired"
        )
    )
)
RETURN "#" &a& "Component DM's - Click here for more details"
Explanation
Define Variable a:
- The variable
ais calculated using theCOUNTROWSandFILTERfunctions to count rows in theTablethat meet the specified conditions. If the count is blank, it returns 0; otherwise, it returns the count.
Concatenate Count into Text:
This approach ensures that you can display the count of components (CM) directly within your Power BI report, providing clear and concise information to users.
requesttype is “Build”
Platformis “Component”Statusis not “Request rejected”Statusis not “Retired”
The result is a string in the format: “#X Component DM’s – Click here for more details” where X is the count of rows that meet the above conditions.
Example Scenario
Let’s consider an example table with the following data:
| requesttype | Platform | Status |
|---|---|---|
| Build | Component | Active |
| Build | Component | In Progress |
| Build | Component | Request rejected |
| Build | Component | Retired |
| Build | Component | Active |
Explanation
- Filter the Rows:
- Rows where
requesttype= “Build”. - Rows where
Platform= “Component”. - Rows where
Statusis not “Request rejected” and not “Retired”.
In the example table, the rows that meet these conditions are:
| requesttype | Platform | Status |
|---|---|---|
| Build | Component | Active |
| Build | Component | In Progress |
| Build | Component | Active |
Output:
- The DAX formula calculates the count of these rows and concatenates it into the text string.
- The result will be: “#3 Component DM’s – Click here for more details”
To showcase multiple values in a Button concatenated with Text
If you want to display a button with the value below, scroll below

DAX formula calculates the count of rows in a table where the Requesttype is “Build” and the Status is either “Retired” or “Revoked”. It then concatenates these counts into a text string.
Explanation
Variable a:
- Counts the number of rows where
Requesttype= “Build” andStatus= “Retired`. - If the count is blank, it returns 0.
Variable b:
- Counts the number of rows where
Requesttype= “Build” andStatus= “Revoked`. - If the count is blank, it returns 0.
Concatenation:
- Concatenates the counts into the string
"#a Retired / b Revoked DM's - Click here for more details:".
DAX Code
Count of Retired/Revoked DM =
VAR a =
    IF (
        ISBLANK (
            COUNTROWS (
                FILTER (
                    Table,
                    Table[Requesttype] = "Build" &&
                    Table[Status] = "Retired"
                )
            )
        ),
        0,
        COUNTROWS (
            FILTER (
                Table,
                Table[Requesttype] = "Build" &&
                Table[Status] = "Retired"
            )
        )
    )
VAR b =
    IF (
        ISBLANK (
            COUNTROWS (
                FILTER (
                    Table,
                    Table[Requesttype] = "Build" &&
                    Table[Status] = "Revoked"
                )
            )
        ),
        0,
        COUNTROWS (
            FILTER (
                Table,
                Table[Requesttype] = "Build" &&
                Table[Status] = "Revoked"
            )
        )
    )
RETURN
    "#" & a & " Retired / " & b & " Revoked DM's - Click here for more details:"
Example Scenario
Let’s consider an example table with the following data:
| Requesttype | Status |
|---|---|
| Build | Retired |
| Build | Revoked |
| Build | Active |
| Build | Revoked |
| Build | Retired |
Explanation
Count Retired:
- Rows where
Requesttype= “Build” andStatus= “Retired”: 2 rows.
Count Revoked:
- Rows where
Requesttype= “Build” andStatus= “Revoked”: 2 rows.
Output:
- The concatenated string will be:
"#2 Retired / 2 Revoked DM's - Click here for more details:".
Final Output
For the provided example table, the output of the DAX formula will be:
“#2 Retired / 2 Revoked DM’s – Click here for more details:”
This string will be displayed in the visual where the measure is used, such as a card visual in Power BI.
Creating a DAX Measure to Format Created Date as Month (MMM)
Creating a DAX Measure to Format Created Date as Month (MMM)
To create a DAX measure that formats the Created date field as the month abbreviation (e.g., “Jan”, “Feb”), you can use the FORMAT function. This formatted date can then be used in graphs to show data by month.
DAX Measure to Format Created Date
Create the Measure:
- Use the
FORMATfunction to format theCreated dateas the month abbreviation.
Created Date MMM =
FORMAT(Table[Created date], "MMM")
Explanation
- The
FORMATfunction takes two arguments: - The date column (
Table[Created date]). - The format string (
"MMM") which converts the date to a three-letter month abbreviation.
Use in a Graph:
- Add a visual like a bar chart or line chart to your report.
- Use the
Created Date MMMcolumn on the X-axis to show data grouped by month. - Ensure that your data model is set up to aggregate data by month.
Example
Let’s consider an example table with the following data:
| Created date |
|---|
| 2024-01-15 |
| 2024-02-20 |
| 2024-03-10 |
| 2024-01-25 |
| 2024-02-18 |
The Created Date MMM column will have the following values:
| Created date | Created Date MMM |
|---|---|
| 2024-01-15 | Jan |
| 2024-02-20 | Feb |
| 2024-03-10 | Mar |
| 2024-01-25 | Jan |
| 2024-02-18 | Feb |
Displaying the Count of Retired/Revoked DM by Month
To show the count of Retired and Revoked DM by month in a graph, you can create additional measures that count the occurrences of each status by month.
DAX Measures for Count of Retired and Revoked by Month
Count of Retired DM =
CALCULATE (
    COUNTROWS (Table),
    Table[Requesttype] = "Build" &&
    Table[Status] = "Retired"
)

Count of Revoked DM =
CALCULATE (
    COUNTROWS (Table),
    Table[Requesttype] = "Build" &&
    Table[Status] = "Revoked"
)
- Create a Graph:
- Add a visual like a clustered column chart to your report.
- Use
Created Date MMMon the X-axis. - Use
Count of Retired DMandCount of Revoked DMas the values.
This setup will display the count of Retired and Revoked DMs by month, providing a clear visual representation of the data trends over time.
To find and count duplicate Delivery Map names (DMs) in a column using DAX, you can create a calculated column that marks duplicates with a 1 and non-duplicates with a 0. Your provided DAX formula is mostly correct, but it needs a slight adjustment to work in Power BI.
Step-by-Step Explanation
Define the Calculated Column:
- Use the
CALCULATEandCOUNTfunctions to count occurrences of eachDeliverymapname. - Use the
EARLIERfunction to refer to the current row context.
Implement the IF Statement:
- If the count of
Deliverymapnameis greater than 1, mark it as a duplicate (1). - Otherwise, mark it as not a duplicate (0).
DAX Formula for Duplicate Detection
Duplicate DM =
IF (
    CALCULATE (
        COUNT (Table[Deliverymapname]),
        FILTER (
            Table,
            Table[Deliverymapname] = EARLIER (Table[Deliverymapname])
        )
    ) > 1,
    1,
    0
)
Explanation
- COUNT Function:
- Counts the occurrences of each
Deliverymapname.
- CALCULATE and FILTER Functions:
CALCULATEmodifies the context in which the data is evaluated.FILTERnarrows down the table to rows whereDeliverymapnamematches the current row’sDeliverymapname.
- EARLIER Function:
- Refers to the row context of the outer row, allowing comparison within the current context.
- IF Statement:
- Checks if the count of
Deliverymapnameis greater than 1, indicating a duplicate.
- Analyze Duplicate Data:
- You can now use the
Duplicate DMcolumn to analyze and visualize the duplicate entries. - For instance, use a visual to count the number of duplicates or to filter the table to show only duplicates.
Example
Consider the following table:
| Deliverymapname |
|---|
| DM1 |
| DM2 |
| DM1 |
| DM3 |
| DM2 |
The Duplicate DM column will have the following values:
| Deliverymapname | Duplicate DM |
|---|---|
| DM1 | 1 |
| DM2 | 1 |
| DM1 | 1 |
| DM3 | 0 |
| DM2 | 1 |
This marks the duplicates with a 1 and non-duplicates with a 0, helping you identify and analyze duplicate Delivery Map names in your data.
To find the unique count of Delivery Map names (DMs) that have a specific status, such as “Published”, you can use a combination of DAX functions: CALCULATE, DISTINCTCOUNT, and FILTER. This allows you to apply a condition to the DISTINCTCOUNT function.
DAX Measure for Unique Count of Published DMs
Here is a DAX measure that calculates the unique count of DMs with the status “Published”:
Unique Published DM Count =
CALCULATE (
    DISTINCTCOUNT (Table[Deliverymapname]),
    Table[Status] = "Published"
)
CALCULATE: Modifies the context in which the data is evaluated.
- DISTINCTCOUNT (Table[Deliverymapname]): Counts the number of distinct values in the
Deliverymapnamecolumn. - Table[Status] = “Published”: Filters the table to include only rows where the
Statuscolumn is “Published”.
Usage in Power BI
Add the Measure:
- Go to the
Modelingtab in Power BI. - Click on
New Measure. - Enter the above DAX formula.
Use the Measure in Visuals:
- You can use this measure in various visuals, such as cards, tables, or charts, to display the unique count of Delivery Map names that are published.
Example
Consider the following table:
| Deliverymapname | Status |
|---|---|
| DM1 | Published |
| DM2 | Draft |
| DM1 | Published |
| DM3 | Published |
| DM2 | Published |
| DM4 | Draft |
The Unique Published DM Count measure will return 3, as there are three unique Delivery Map names with the status “Published” (DM1, DM2, DM3).
Using the Measure in a Visual
- Card Visual:
- Add a card visual to your report.
- Drag the
Unique Published DM Countmeasure to the card visual to display the count of unique published Delivery Map names. - Table Visual:
- Add a table visual to your report.
- Drag the
Deliverymapnamecolumn and theUnique Published DM Countmeasure to the table to see the unique count alongside the list of Delivery Map names that are published.
This measure provides a precise count of unique Delivery Map names that are in the “Published” status, enabling detailed analysis and reporting in your Power BI dashboards.
Financial Year Dropdown
Extracting the Year from a Date
To start, let’s dive into a simple yet powerful task: extracting the year from a date column. This is useful for grouping data by year or creating time-based comparisons. The formula YEAR(Table[DateColumn]) efficiently retrieves the year from the specified date column.
Year from Date = YEAR(Table[DateColumn])
Creating Fiscal Year Formats
In many financial analyses, Fiscal Year (FY) formats are preferred over calendar years. Let’s create a formula to dynamically generate FY formats like “FY20”, “FY21”, etc., based on calendar year data. This involves extracting the last two digits of the year and concatenating them with “FY”.
FY Format = "FY" & RIGHT(YEAR(Table[DateColumn]), 2)
Example Scenario
Imagine you have a dataset with sales data spanning multiple years. Using these formulas, you can easily create visuals that show sales trends by year or fiscal period, aiding in insightful financial reporting and decision-making.
Financial Quarter
To find the quarter from a date in Power BI using DAX, you can use the QUARTER function. This function returns the quarter (1 to 4) of a given date.
Quarter from Date = QUARTER(Table[DateColumn])
If your date column (Table[DateColumn]) contains dates like 2024-07-10, 2023-12-15, etc., the Quarter from Date measure will return:
3for the date2024-07-10(since July is in the third quarter)4for the date2023-12-15(since December is in the fourth quarter)
Formula to Create Quarter Format (Q1, Q2, Q3, Q4)
You have a couple of options to achieve this. One approach is using the SWITCH function:
Quarter Format =
SWITCH (
TRUE (),
QUARTER(Table[DateColumn]) = 1, “Q1”,
QUARTER(Table[DateColumn]) = 2, “Q2”,
QUARTER(Table[DateColumn]) = 3, “Q3”,
QUARTER(Table[DateColumn]) = 4, “Q4”
)
Alternatively you can use nested If statement
Quarter Format =
IF (
QUARTER(Table[DateColumn]) = 1, “Q1”,
IF (
QUARTER(Table[DateColumn]) = 2, “Q2”,
IF (
QUARTER(Table[DateColumn]) = 3, “Q3”,
IF (
QUARTER(Table[DateColumn]) = 4, “Q4”
)
)
)
)
Explanation
- QUARTER(Table[DateColumn]): Retrieves the quarter number (1 to 4) from the specified date column.
- SWITCH (TRUE(), …): Evaluates each condition and returns the corresponding quarter format (“Q1”, “Q2”, etc.).
- IF (condition, value_if_true, value_if_false): Nested
IFstatements check each quarter number and return the respective quarter format.
If Table[DateColumn] contains dates like 2024-07-10, 2023-12-15, etc., the Quarter Format measure will return:
- “Q3” for the date
2024-07-10(since July is in the third quarter) - “Q4” for the date
2023-12-15(since December is in the fourth quarter)
Fianncial Month
To create a custom quarter format that includes specific month abbreviations (e.g., Q1-Jul, Q1-Aug, Q1-Sep, Q2-Oct) based on a date column in Power BI using DAX, you can combine the QUARTER function with conditions to specify the month ranges for each quarter. Here’s how you can approach this:
Formula to Create Custom Quarter Format
You can use a combination of SWITCH function or IF statements along with MONTH function to achieve this. Here’s an example using SWITCH function:
Quarter Format Custom =
SWITCH (
    TRUE (),
    AND(QUARTER(Table[DateColumn]) = 1, MONTH(Table[DateColumn]) >= 7, MONTH(Table[DateColumn]) <= 9), "Q1-Jul",
    AND(QUARTER(Table[DateColumn]) = 1, MONTH(Table[DateColumn]) = 10), "Q1-Oct",
    AND(QUARTER(Table[DateColumn]) = 2, MONTH(Table[DateColumn]) = 10), "Q2-Oct",
    // Add more conditions for other quarters and months as needed
    BLANK () // Default return value if no conditions match
)
Explanation
- QUARTER(Table[DateColumn]): Retrieves the quarter number (1 to 4) from the specified date column.
- MONTH(Table[DateColumn]): Retrieves the month number (1 to 12) from the specified date column.
- SWITCH (TRUE(), …): Evaluates each condition and returns the corresponding custom quarter format (“Q1-Jul”, “Q1-Aug”, etc.).
- AND(condition1, condition2, …): Combines multiple conditions together. For example,
AND(QUARTER(Table[DateColumn]) = 1, MONTH(Table[DateColumn]) >= 7, MONTH(Table[DateColumn]) <= 9)checks if the date is in Q1 and between July to September.
Example
If Table[DateColumn] contains dates like 2024-07-10, 2023-08-15, 2023-10-20, etc., the Quarter Format Custom measure will return:
- “Q1-Jul” for the date
2024-07-10 - “Q1-Aug” for the date
2023-08-15 - “Q2-Oct” for the date
2023-10-20
You can extend this formula to cover all quarters and their respective months as per your reporting or analysis requirements. This custom quarter format is useful for creating specific time-based groupings in your Power BI reports, tailored to your business needs.
Finanical year starting from Jul
To create a custom quarter format that includes specific month abbreviations (e.g., Q1-Jul, Q1-Aug, Q1-Sep, Q2-Oct) based on a date column in Power BI using DAX, you can combine the QUARTER function with conditions to specify the month ranges for each quarter. Here’s how you can approach this:
Creating Custom Quarter Format (e.g., Q1-Jul, Q1-Aug)
You can use a combination of SWITCH function or IF statements along with MONTH function to achieve this. Here’s an example using SWITCH function:
Quarter Format Custom =
SWITCH (
    TRUE (),
    AND(QUARTER(Table[DateColumn]) = 1, MONTH(Table[DateColumn]) >= 7, MONTH(Table[DateColumn]) <= 9), "Q1-Jul",
    AND(QUARTER(Table[DateColumn]) = 1, MONTH(Table[DateColumn]) = 10), "Q1-Oct",
    AND(QUARTER(Table[DateColumn]) = 2, MONTH(Table[DateColumn]) = 10), "Q2-Oct",
    // Add more conditions for other quarters and months as needed
    BLANK () // Default return value if no conditions match
)
Explanation
- QUARTER(Table[DateColumn]): Retrieves the quarter number (1 to 4) from the specified date column.
- MONTH(Table[DateColumn]): Retrieves the month number (1 to 12) from the specified date column.
- SWITCH (TRUE(), …): Evaluates each condition and returns the corresponding custom quarter format (“Q1-Jul”, “Q1-Aug”, etc.).
- AND(condition1, condition2, …): Combines multiple conditions together. For example,
AND(QUARTER(Table[DateColumn]) = 1, MONTH(Table[DateColumn]) >= 7, MONTH(Table[DateColumn]) <= 9)checks if the date is in Q1 and between July to September.
Example
If Table[DateColumn] contains dates like 2024-07-10, 2023-08-15, 2023-10-20, etc., the Quarter Format Custom measure will return:
- “Q1-Jul” for the date
2024-07-10 - “Q1-Aug” for the date
2023-08-15 - “Q2-Oct” for the date
2023-10-20
You can extend this formula to cover all quarters and their respective months as per your reporting or analysis requirements. This custom quarter format is useful for creating specific time-based groupings in your Power BI reports, tailored to your business needs.
Calculating Inactive Aging in Power BI
Inactive Aging =
IF (
Table[STATUS] = “INACTIVE”,
NETWORKDAYS(Table[LAST STATUS CHANGE], NOW(), 1),
0
)
Explanation:
- IF (condition, value_if_true, value_if_false): Checks if the status is “INACTIVE”. If true, it calculates the network days between the
LAST STATUS CHANGEdate and the current date (NOW()). - NETWORKDAYS(start_date, end_date, holidays): Calculates the number of working days (excluding weekends and optionally specified holidays) between
start_dateandend_date. - Table[STATUS]: Refers to the column where the status information is stored.
- Table[LAST STATUS CHANGE]: Refers to the column where the last status change date is recorded.
- NOW(): Returns the current date and time.
Usage:
- Ensure that your
Tableand column names (STATUSandLAST STATUS CHANGE) are correctly substituted with your actual data model names. - This formula will calculate the number of working days between
LAST STATUS CHANGEand the current date (NOW()) only if theSTATUSis “INACTIVE”. If not, it returns0.
Streamlining Status Representation in Power BI
Intake Parent Status =
IF (
Table[STATUS] = “RETIRED” || Table[STATUS] = “REVOKED”,
“REQUEST COMPLETED”,
Table[STATUS]
)
Explanation:
- IF (condition, value_if_true, value_if_false): Checks if the status is either “RETIRED” or “REVOKED”. If true, it assigns the value “REQUEST COMPLETED”. Otherwise, it keeps the original status from the
Table[STATUS]column. - Table[STATUS]: Refers to the column where the status information is stored.
Usage:
- Replace
Table[STATUS]with your actual column name where the status information is stored in your Power BI dataset. - This formula simplifies status changes by mapping “RETIRED” and “REVOKED” statuses to “REQUEST COMPLETED”, while leaving other statuses unchanged.
Defining and Implementing Custom Status Sorting in Power BI
1. Define the Status Sort Order Table:
DAXCopy codeStatus Sort Order Table =
DATATABLE (
    "Status", STRING,
    "ID", INTEGER,
    {
        {"under review", 1},
        {"In progress", 2},
        {"On hold", 3},
        {"request rejected", 4},
        {"published", 5},
        {"request completed", 6},
        {"retired", 7}
    }
)
2. Create a Measure to Retrieve the Sort Order:
Assuming you want to create a measure (StatusOrderForSorting) to retrieve the sort order based on a related status from another table:
DAXCopy codeStatusOrderForSorting =
SWITCH (
    RELATED('Status Sort Order Table'[Status]),
    "under review", 1,
    "In progress", 2,
    "On hold", 3,
    "request completed", 4,
    "request rejected", 5,
    "retired", 6,
    BLANK()  // Add a default return value if no match
)
Explanation:
- Status Sort Order Table: Defines a table (
DATATABLE) with columns forStatusandID, listing each status with its corresponding numerical index (ID). - StatusOrderForSorting Measure: Uses the
SWITCHfunction to return the numerical index (ID) based on the related status from theStatus Sort Order Table. If no match is found, it returnsBLANK().
Usage:
- Replace
'Status Sort Order Table'with your actual table name if it differs in your Power BI model. - Use the
StatusOrderForSortingmeasure in visuals (like tables or charts) where you want to sort or group data based on the predefined status order.
Discover more from LR Virtual Classroom
Subscribe to get the latest posts sent to your email.
