
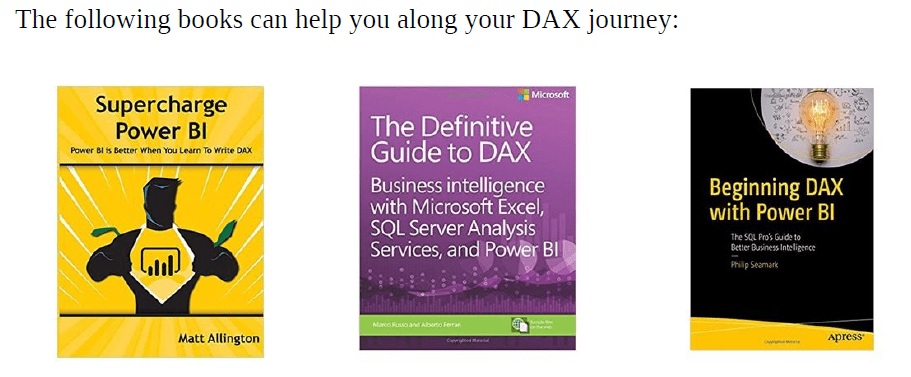
Recently, I read an amazing book – Power BI MVP Book: A book of Tricks and techniques for working with Power BI written by 21 MVP professionals from all around the world.
The book has 21 chapters each written by 21 MVPs. Must read by all PL-300 aspirants. Here are the titbits from each chapter.
Chapter 1: Using Power Query to tell your story from your Facebook Data
In chapter 1, Anil Maharjan explains on how you can extract the story behind your Facebook data. He shows by using Power Query along with Power BI you can extract your Facebook data easily and analyze your own story by using your Facebook data. This chapter helps you to learn about Power Query and Power BI and shows you how to use self-service BI based on your Facebook data.
Power Query can connect data across a wide variety of sources, where Facebook is just one of the data sources. By using Power Query, you can extract your Facebook data easily and do analysis of your own story by using your Facebook data.
Power Query also provides a Custom Connectors SDK so that third parties can create their own data connectors and seamlessly plug them into Power Query.
Choose the online services tab where you can see different online services data sources. Facebook is one of them.
You can go to New Source tab -> Online Service -> Facebook which
will open up as below and ask for you Facebook account credentials. Log in to
Facebook and you are able to get your Facebook data as like feed, comments,
likes, friends etc.
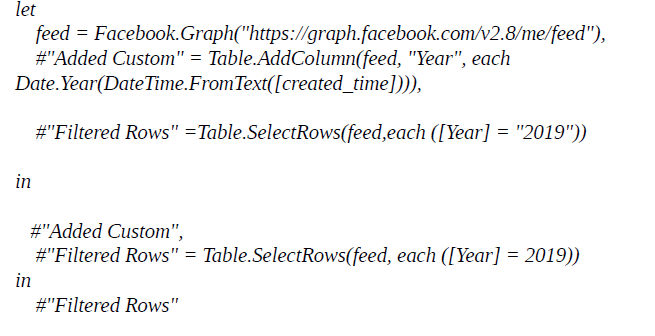
For Facebook Photos by Location tracking, using the below Power Query.
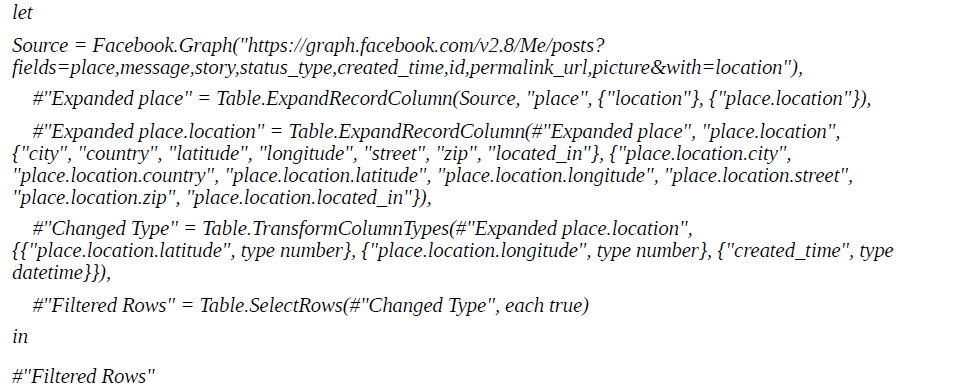
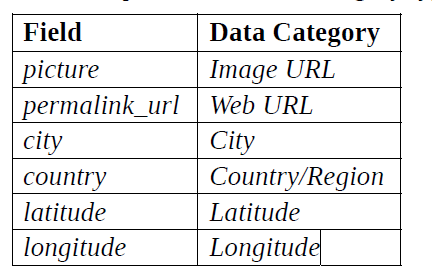
Then you need to change the picture, permalink_url and Geo location fields with the correct data category type in order to render picture as image, url as links and Geolocation fields will work on maps.
Chapter 2: Get Data from Multiple URLs Using Web By Example
In chapter 2, Indira Bandari explains how to scrape data off a blog site
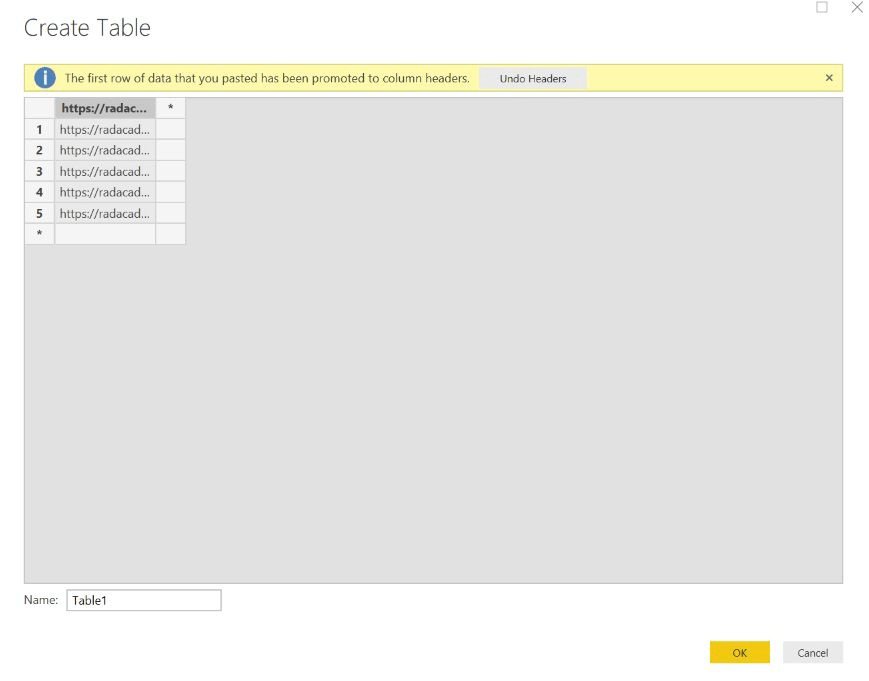
(http://radacad.com/blog) using the “Add Data By Example” button in Power BI. She then uses Power Query to create a function that gets the blog URLs from a table and extract the data from these URLs. This process can be extended to extract data from any website that has a pattern.
The process will be described under three stages:
- Get Data from Web By Example from a single webpage – Since there is no login required to view the blog articles, choose Basic while importing.
- Choose the required data and make a base query with the list of columns from the web page.
- Create a blank Table query with the list of other URL’s to fetch the data similar to base query.
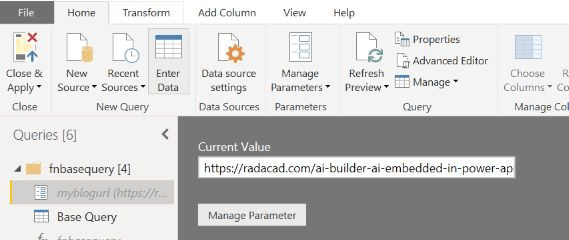
- Create a Parameter – To create a parameter, click on ‘Manage Parameters – New Parameter’.
- Change the name of the new parameter to “myblogurl”, as well as the Type to Text and in the ‘Current Value’ field paste URL https://radacad.com/ai-builder-ai-embedded-in-power-apps-part-2.
3. The next task is to create a function. Below are the steps to create a function. Step 1: In the Power Query Editor, click on the query you have created in the first stage named ‘Base Query’. Then, click on ‘Advance Editor’:
4. Replace the URL including the quotation marks with the name of the
parameter (myblogurl)
5. Now right click on the ‘Base Query’ and click on ‘Create Function’. Give a name to the function and click Ok. The function of the base query looks as below.
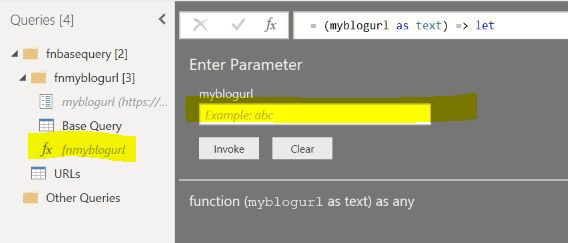
6. Now you can test the function by copying the URL https://radacad.com/aibuilder-ai-embedded-in-power-apps-part-2 in the text box highlighted above and clicking Invoke.
7. Invoke custom function is very powerful for retrieving data from multiple sources.
Chapter 3: One URL, Many Tables
In chapter 3, Liam Bastick considers how to import a multiple page table into Power Query when the URL does not appear to change. It’s harder than you might think and took the best ideas of several contributors to construct a practical solution. Nonetheless, it’s a very useful and important technique to learn and highlights common problems faced when extracting data from the internet.
To summarize, we have three key issues:
- We are unable to manually pull all data from the website
- We do not know how many pages of data the website has (and this may
change over time) - The webpage does not change its URL when a new page of data is displayed.
A custom function is a query that is run by other queries. For those of you who know JavaScript, it is similar to what is known as an Object Method. The benefit of having a custom function is that we can repeat the same number of steps again and again.
The author has provided step by step to solve the above 3 issues using custom function, creating parameter, invoking custom function and writing query to fetch the data from all the pages.
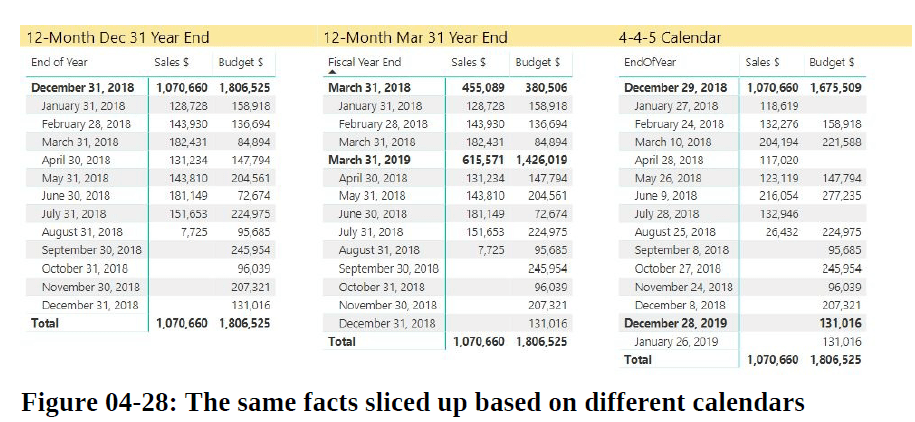
Chapter 4: Creating Calendar Dimensions with Power Query
In chapter 4, Ken Puls shows you how easy it is to create dynamic calendar
tables on the fly with Power Query inside Power BI. Whether you need a
standard 12-month calendar with a December 31 year end, a 12-month calendar with a March 31 year end, or even a 4-4-5 calendar, Power Query can create it for you if your IT department doesn’t have one you can use. And the best part? They’ll automatically update to cover the entire data range of your model!
Disadvantages of using Power BI Date Table —
While Microsoft does provide default date functionality, I’ll admit that I’m not a fan of it. Why? Because I don’t have ultimate control over what gets added to my data model and how.
- Using this functionality adds a hidden table to your model for every column of each table that contains date values. That means that if you have three different tables with dates in them, and you don’t declare a
specific date table properly, you get three copies of a hidden date table in your model. - And if one of those tables contains a “StartDate” and “EndDate”
column, you actually get four hidden tables, as each column is treated
differently! Each of these hidden tables holds columns for Date, Day, Month, MonthNo, Quarter, QuarterNo, and Year fields, and takes memory to store the unique values. - In addition, without being properly linked to the other fact tables
in the models, they don’t offer you the benefit of cross-filtering, as a properly linked calendar dimension table does.
To turn off this feature (both globally and for the current file):
● Go to File -> Options and Settings -> Options
● Go to Global -> Data Load -> uncheck ‘Auto date/time for new files’
● Go to Current File -> Data Load -> Time intelligence -> uncheck ‘Auto
date/time’.
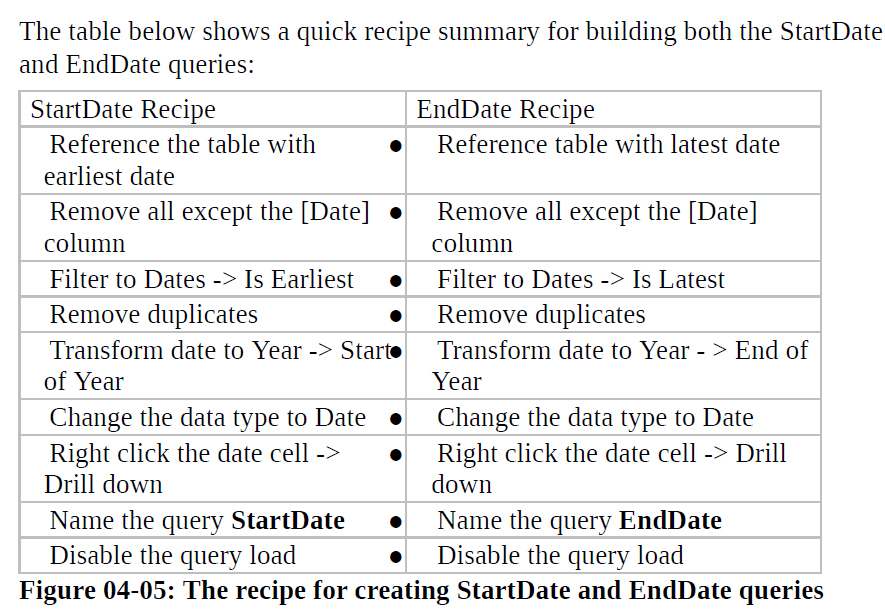
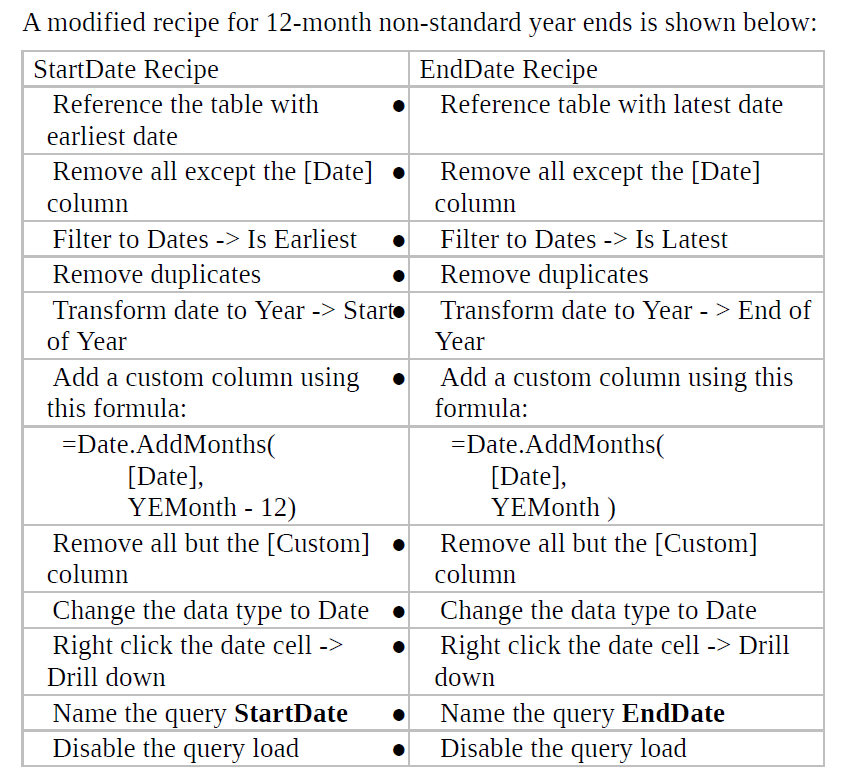
Building the Base Calendar table
With the StartDate and EndDate queries set up, building the basic calendar table becomes very easy:
● Create a new blank query (right-click in the Queries pane -> New Query – Blank Query)
● Rename the query as Calendar
● Enter the following formula in the formula bar:
={Number.From(StartDate)…Number.From(EndDate)}
● Go to List Tools -> Transform -> To Table -> OK
● Change [Column1] to a Date type
● Rename [Column1] to Date
Your StartDate and EndDate queries must be capitalized consistently with the names of the queries you set up earlier. And if you put in spaces, you’ll need to escape them with #” ” like this: ={Number.From(#”Start Date”)..Number.From(#”End Date”)}
While Power BI does provide automatic date hierarchies for models, there are
times where you’ll prefer to take control of this yourself, or where you’ll need to add date formats that fall outside the standard Year, Quarter, Month and Day provided by the hierarchy. Power Query provides many additional date
transformations for you, which you can add to your table as follows:
- Select Home -> Edit Queries
- Edit the Calendar query
- Select your Date column
- Add Column -> Date -> select the format you wish to add
- Repeat steps 2-3 as many times as necessary
- Go to Home -> Close & Apply to load the new data into your model.
And that’s it! You’ve got a fully dynamic calendar that will scale with your
data!
Add Fiscal Year Ends to Your Calendar
The base Calendar is all well and good, but what if you don’t work with a
standard year end that ends on December 31 each year? This is not a problem at all, and we can even add columns for Fiscal Year, Fiscal Quarter and Fiscal
Month.
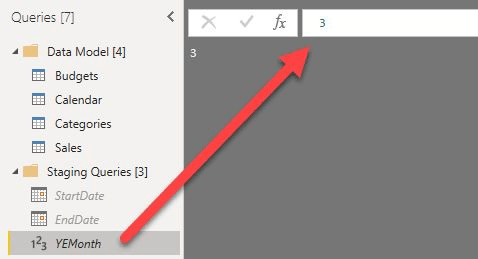
● Create a new blank query
● Rename the query to YEMonth
● In the formula bar enter the numeric value of the final month of your year
end (i.e. for a March 31 year-end, enter 3, for a July 31 year end, enter 7)
● Right click the query in the Queries pane and uncheck Enable Load.
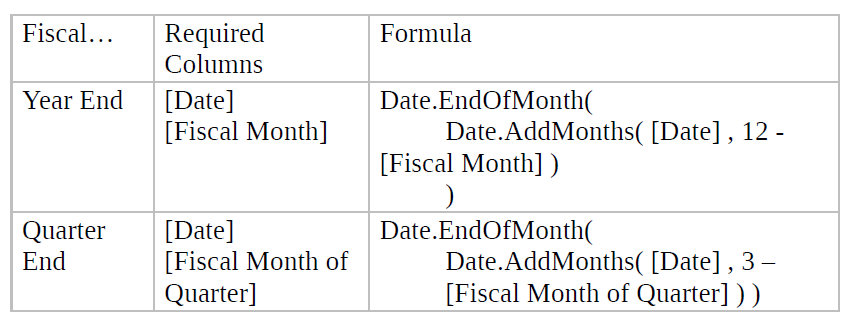
Fiscal Year End
The most important field in the previous section is by far the [Fiscal Month]
column.
With that created, it becomes fairly easy to create our Fiscal Year End
and Fiscal Quarter End columns:
This chapter also explains the Building a 4-4-5, 4-5-4 or 5-4-4 (ISO) Calendar in detailed way.
Chapter 5: Transform and combine your data with ETL tool named Power Query
In chapter 5, Jesus Gil explains how easy it is to use Power Query, the ease of use application, and implementation with the tool. It quickly explains the
concept of ETL and how we can build it with Power Query, either by clicking or through the M language.
Do you remember the famous Power BI on Excel?
● Power Query
● Power Pivot
● Power Map
● Power View
With Power Query, we will be building the ETL process to copy data from one or more sources into Power BI, as described in the steps below:
- Extraction: will copy or extract data from sources (homogenous or
heterogeneous) - Transformation: will process the data and apply for example data cleansing, data types conversions, business rules, etcetera and finally transform the data in a format that can be understood by Power BI
- Load: will be the process responsible for inserting the data into our Power BI data model
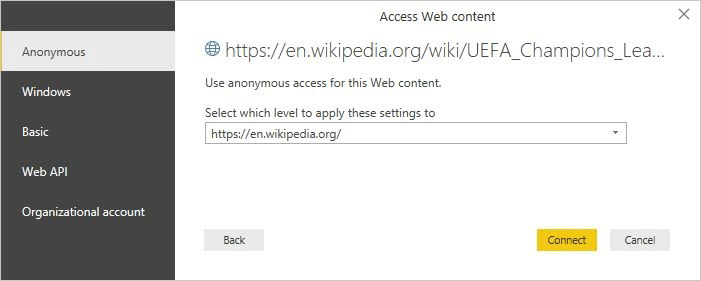
The Access Web Content window asks us the type of access we will have to the site. In our case, we choose Anonymous access (because we don’t need any kind of credential to get the info) and then click on the Connect button.
● Tip: the best practice is always to verify the data authenticity, use
Windows or Organizational account over all when we will get sensitive
data.
Points to make note of:
● Number of columns and rows uploaded
● Preview Downloaded time
This info is very important for doing a quick audit of the newly loaded data.
One easy way to change data type is using the Detect Data Type button,
which will change the data type for you automatically. But please always
validate the result and, if it is not right, change manually as explained
before.
Other way is to select the column, mouse right click and click Change
Type on the popup menu, then select Whole Number.
Check out the most commonly used transformations – Add columns, Delete Columns, Choose Columns, Use First Row as Header, Use Header as First Row etc.
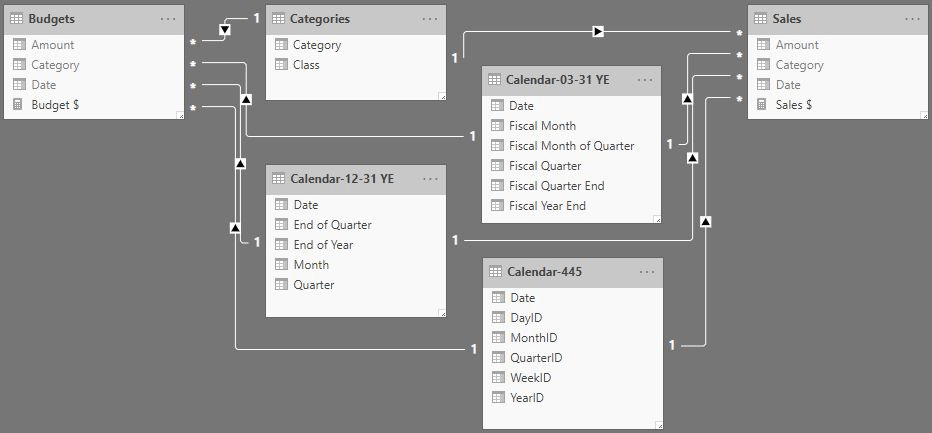
Chapter 6: Creating a Shared Dimension in Power BI Using Power Query: Basics and Foundations of Modeling
In Chapter 7, Thomas LeBlanc looks at the benefits of a good relational data
model in Power BI. If someone is using a flat file and flattened table for Power
BI, data modeling improves the re-usability of a single source of truth. Concepts covered include relationships between tables, using the correct data types for columns as well as measures for repeatable calculations.
The relational database example is a dimensional model and the chapter concludes with a look at a many-to-many relationship with bi-directional filtering.
Key pointers from this lesson are as below:
- The problem with the flat file is someone will want one more column to be added to the flattened structure, and the data has to be repopulated all over again. The advantage of a dimensional model database is the data is already in the tables that have been imported.
- Importing is a better option for performance than DirectQuery.
- DirectQuery also does not allow relating tables from different sources. Importing will bring the data into the analytical engine of Power BI. Data is structured in a column store architecture with compression. This structure is best for analytical aggregations.
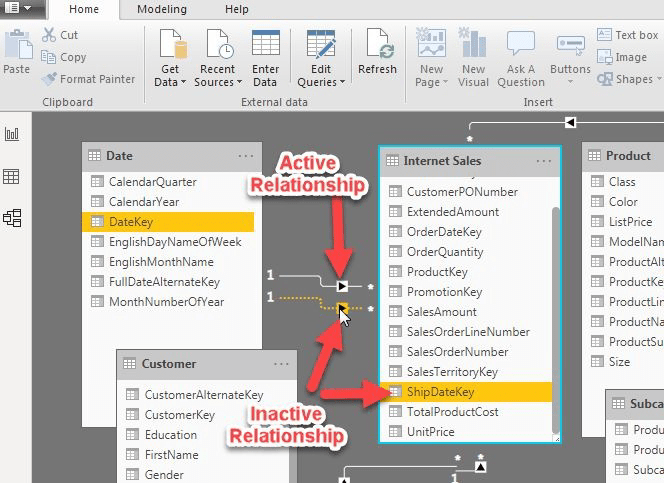
- If there is more than one relationship between two tables, one has to be selected as active. In this case, the OrderDateKey is the active relationship between FactInternetSales and DimDate. The inactive relationship can be used in DAX formulas.
5. Data Type – The data types pull over well with a relational database. There are a few things you should be aware of that can happen.
- The first is Default Summarize. The Default Summarize is assigned to numeric columns. Usually, this is Count for integers and Sum for numeric with decimals. This works fine for a simple summation of Sales. But, it does not do well for the integer columns for relationships.
- Next, the category might not be assigned for a column like geography.
- The last item would be the assignment of the incorrect numeric data type.
6. Additional Fact Table – When modeling, multiple fact tables can be related to the same dimensions. This allows a slicer like Product Category to show a summation for sales related to internet sales as well as reseller sales.
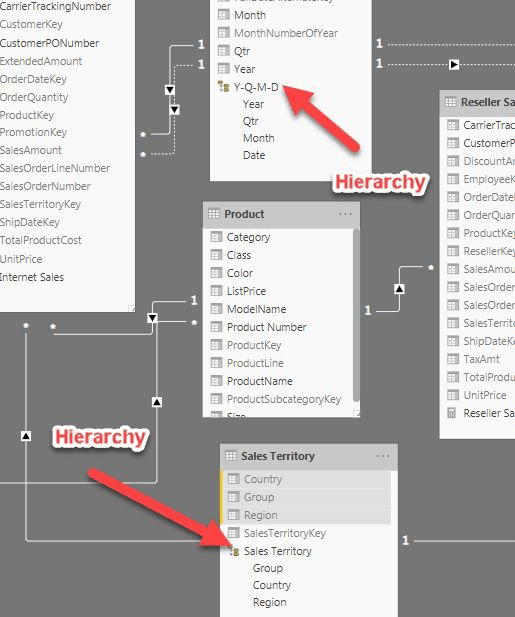
7. Hierarchies can be modelled for dimension tables. The columns used in a
hierarchy have to be in one table.
Chapter 8: Up and Running with DAX as Quick as Possible
In this chapter we’ll get you started with the 80% of DAX that you need to
know. You’ll learn how to use measures and calculated columns to add amazing value to your Power BI reports.
- You’ll start easy with SUM and AVERAGE and then finish with the harder topics like CALCULATE, Time Intelligence, FILTER, ALL, variables, debugging, and troubleshooting.
- You need to know these functions: SUM, AVERAGE, MIN, MAX, COUNT,
COUNTROWS, CALCULATE, and VARIABLES. - You need to know about the Row Context and the Filter Context.
- You would need to learn best practices related to formatting, white space, time intelligence, X vs nonX functions (SUM vs SUMX), DAX Studio, and basic troubleshooting.
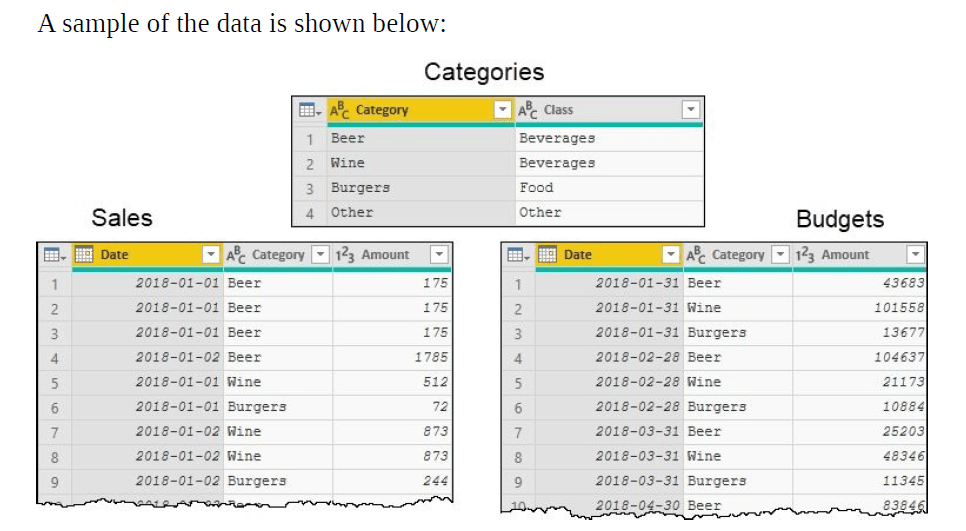
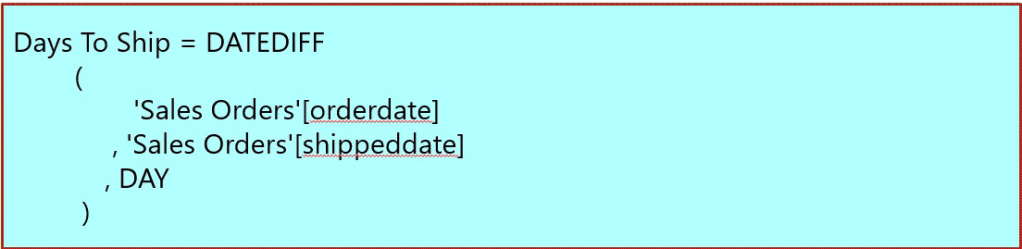
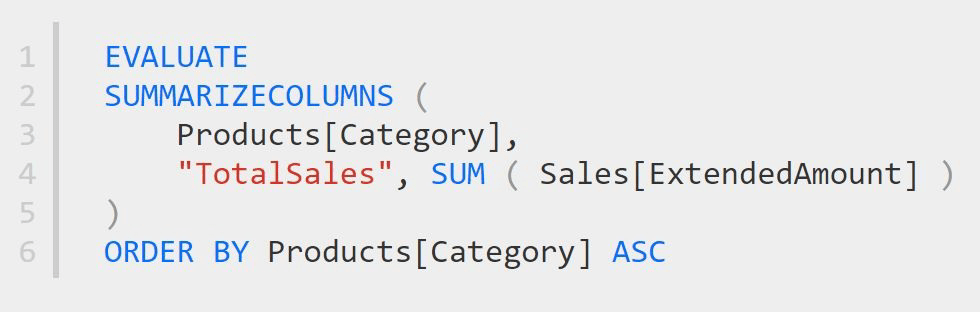
Basic measure - Order Line Total = 'Sales OrderDetails'[qty] * 'Sales OrderDetails'[unitprice]Total Sales = SUM('Sales OrderDetails'[Order Line Total])Calculated column - Days To Ship = DATEDIFF('Sales Orders'[orderdate], 'Sales Orders'[shippeddate],DAY) [ It calculates how long it took to ship something.]Average Days to Ship = AVERAGE('Sales Orders'[Days To Ship])Dates = CALENDAR("1/1/2000", "12/31/2016")
This DAX expression creates a dates table from 1/1/2000 to 12/31/2016Calculate DAX:
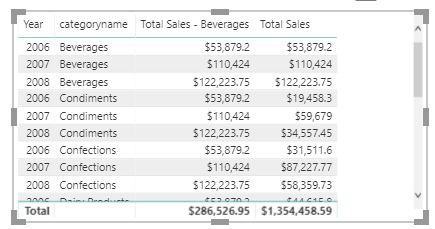
Total Sales (Beverages) = CALCULATE
(
SUM('Sales OrderDetails'[Order Line Total])
, 'Production Categories'[categoryname] = "Beverages"
)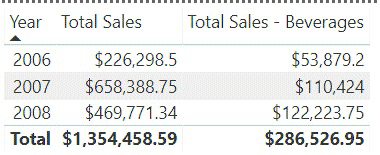
Notice how no matter which category is specified in the filter context, the
total amount is always the same for Total Sales – Beverages. This is
because the CALCULATE function is overriding the filter context.
Total Sales (Beverages in USA) = CALCULATE(
sum('Sales OrderDetails'[Order Line Total])
, 'Production Categories'[categoryname]= "Beverages"
, 'Sales Customers'[country] = "USA"
This measure uses CALCULATE to override both the category name
(forcing Beverages) and country (forcing USA).
Total Sales For Customers with Minimum Order Count =
VAR MinimumOrderCount = 5
VAR CustomersWithMinimumOrders = CALCULATE
(
sum('Sales OrderDetails'[Order Line Total])
, FILTER('Sales Customers', [Number of Orders] > MinimumOrderCount)
)
RETURN CustomersWithMinimumOrders
This measure is multiple lines. It declares two variables. The first
variable is titled MinimumOrderCount. It has an assigned value of 5.
The second variable is titled CustomersWithMinimumOrders. It uses the
CALCULATE function to only aggregate Order Line Total for customers
that meet the minimum order count.
The RETURN statement does not need to return the last variable. Change
the RETURN statement to return MinimumOrderCount instead of
CustomersWithMinimumOrders.
The code would look like this:
Total Sales For Customers with Minimum Order Count =
VAR MinimumOrderCount = 5
VAR CustomersWithMinimumOrders = CALCULATE
(
sum('Sales OrderDetails'[Order Line Total])
, FILTER('Sales Customers', [Number of Orders] > MinimumOrderCount)
)
RETURN MinimumOrderCount
Time Intelligence – YTD
YTD Total Sales = TOTALYTD
(
SUM('Sales OrderDetails'[Order Line Total])
, Dates[Date].[Date]
Similar to the CALCULATE function, the TOTALYTD function also
manipulates the filter context. It creates a running total for the year, no
matter which dates, months, quarters, or years have been selected.
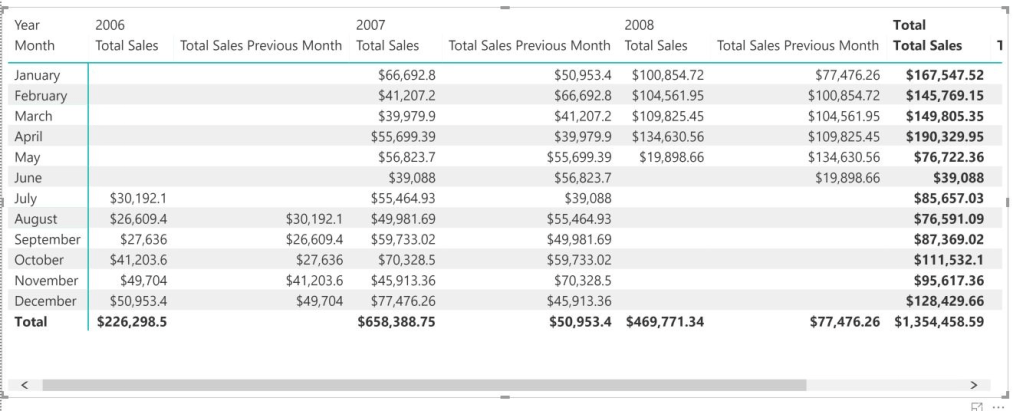
Time Intelligence – PREVIOUSMONTH
Total Sales Previous Month = CALCULATE
(
sum('Sales OrderDetails'[Order Line Total])
, PREVIOUSMONTH(Dates[Date])
)
CALCULATE and PREVIOUSMONTH overrides the filter context to
display the value for the previous month selected.
X vs Non-X Functions
The X functions are what are called iterator functions. They are important where the value is important in the context of a row. It works row by row.
SUMX has awareness of rows in a table, hence can reference the intersection of each row with any columns in the table. SUMX will add values as it relates to the entire row that is iterating.
Total Sales SUMX = SUMX(
'Sales OrderDetails'
, 'Sales OrderDetails'[qty] * 'Sales OrderDetails'[unitprice]
)
SUM can only operate on one column.
This measure takes the total number of qty in OrderDetails and multiplies it with the total UnitPrice. This is very bad logic and results in $2,899,457,198.47.
This result is very wrong.
BadMeasure = (SUM('Sales OrderDetails'[unitprice]) *
Sum('Sales OrderDetails'[qty]))
SUMX is necessary because it preserves the row value and ties the correct qty
with the correct unitprice.
Best Practice: Organize your code
This author recommends keeping measures together in one table. You may want to create more than one table for your measures.
In his experience, you will end up having dozens of measures in your Power BI model. It might be difficult to find a measure if you don’t practice organization.
Best Practice: Naming Columns & Measures
When you name columns and measures, obey the following rules:
- Feel free to use spaces
- Avoid acronyms
- Make names terse, but descriptive
- Makes Q & A easier to use
- In formulas, reference table names for calculated columns and do not
reference table names for measures, so you’ll know the difference.
Best Practice: Formatting
DAX Expressions can have lots of parentheses and square brackets.
Please use white space to control help this.
Above is a good example of a properly formatted DAX expression. You can also use the website DaxFormatter.com to help you format your DAX expressions.
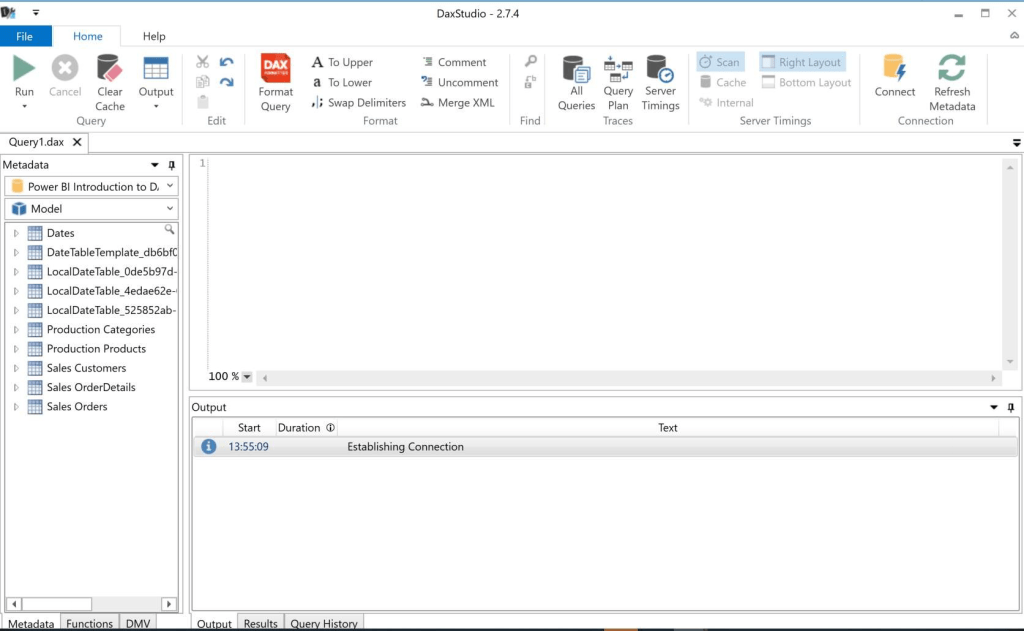
DAX Studio is a great tool for learning DAX and writing DAX expressions. It
was the brainchild of one of the authors of one of the books above, Darren
Gosbell, Marco Russo and Alberto Ferrari. Learning this tool is essential for the
budding DAX developer
Chapter 9: Power BI is Not the Same as Excel
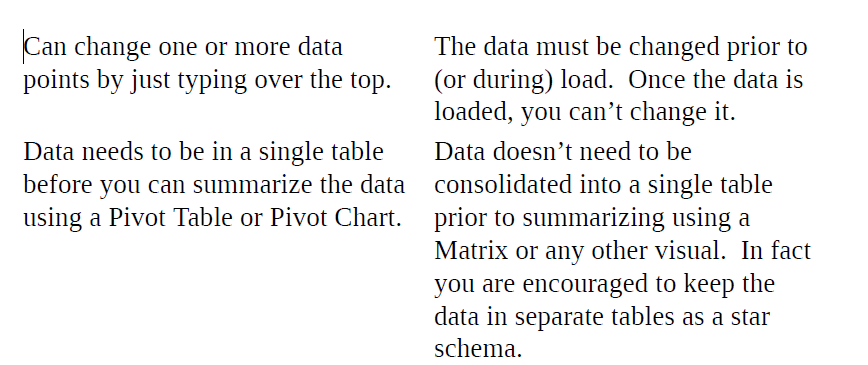
In chapter 9, Matt Allington explains what the differences are between Microsoft Excel and Power BI. Understanding what is the same and what is different is important for people who are trying to move from a traditional Excel world to a structured self-service BI world.
Power BI and Excel are similar in what they can be used for, but they are not the same type of tool.
It can be deceptive because both tools seem to do similar things using a similar approach. For example, Excel has a functional language
that is used for calculations, and Power BI also has a functional language (called DAX).
But that doesn’t mean Excel formulas are exactly the same as DAX
formulas (although they can sometimes be similar).
Power BI is an umbrella term referring to a very broad ecosystem including
Power BI Desktop, the Power BI Service (Powerbi.com), on-premise report
servers, and paginated reports to name just a subset of the total ecosystem.
Power BI Desktop and the PC version of Excel are the tools that are
potential substitutes for each other in the world of self-service business
intelligence reporting.
Some Things Are the Same in Power BI and Excel
- BI Desktop was built with Excel users front of mind. Microsoft did this for a very important reason – it wanted to build a tool that was easy for Excel users to use.
Microsoft corralled key people from the Excel and Analysis Services teams and set them to the task of building a new self-service BI tool. Initially, the team built Power Pivot for Excel.
Then a team was created to build Power Query for Excel and another team worked on Power View for Excel.
Once these three “products” were underway, Microsoft had started to build out all the components needed to create the new tool that we know of today as Power BI.
2. DAX has Many Common Functions with Excel:
At the core of Power BI is the Vertipaq Engine and the DAX Language.
DAX (Data Analysis Expressions) is the formula language of Power BI. Some of the older business intelligence and relational database tools do not have a functional language at all and instead have a scripted query language. Traditional SQL Server Analysis Services has a language called MDX (Multidimensional Expressions).
SQL Server itself uses a scripted query language called T-SQL
(Transactional-Structured Query Language). T-SQL is relatively easy to learn
and MDX is quite hard to learn, but the point is that neither of these database
tools have a functional language like in Excel.
A functional language uses functions to perform a task. I like to think of a function like a black box – you give it some inputs and it gives you some outputs.
You don’t need to know “how” it comes up with the result – that is the job of the function. Consider the function SUM() in Excel. This function takes one or more parameters as input(s) and returns the addition of the values as its output.
Power BI also has a functional language (DAX) and this makes it relatively easy for Excel users to make the transition from Excel functions to DAX functions.
Sometimes Functions Are Similar, But Have Small Differences
Excel Syntax OR(logical1,[logical2],…[logicalN])
Power BI Syntax OR(logical1,logical2)
Do you spot the difference? The Excel syntax will accept 1, 2, 3, or as many
parameters as you need. The Power BI syntax must have 2 and exactly 2
parameters.
For this reason, I am not a big fan of the OR() and AND() syntax in
Power BI. Instead I tend to use the in-line syntax as follows:
Power BI OR Inline Syntax logical1 || logical2 || logicalN.
The double pipe is the “in-line” way of saying OR in DAX.
Many Things Are Very Different Between Power BI and Excel
Power BI is a Database, Excel is a Spreadsheet
Database
A database is a tool that is built to efficiently store and retrieve data. There are
different types of databases including transactional databases (like SQL Server) and reporting databases (like SQL Server Analysis Services SSAS). Power BI is more like SSAS than it is like SQL Server.
The Power BI database is a reporting database. It is not designed to allow you to edit or alter the data that is loaded, but instead to faithfully and efficiently
produce summary reports of the actual data loaded.
Spreadsheet
A spreadsheet is a 2-dimensional page that contains multiple cells in rows and columns. It is an unconstrained “canvas-like” space not unlike a canvas used by an artist to create a picture.
One of the greatest strengths of a spreadsheet is that you can do anything you want with the space. One of the greatest weaknesses of a spreadsheet is, you guessed it, you can do anything you want with the space. A spreadsheet is a doubled-edged sword.
The freedom and flexibility to do whatever you want is its greatest strength and its greatest weakness.
Differences Between a Spreadsheet and a Reporting Database
There are quite a few differences between these things; here are just a few of
them.


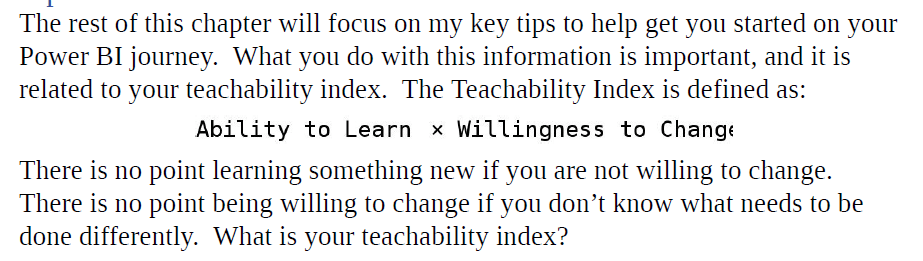
Tips to Get You Started as You Move to Power BI
Excel Users Write Too Many Calculated Columns & SQL Users Write Too Many DAX Table Queries – Everyone Should Be Writing Lots of Measures
Measures have a lot of benefits over Calculated Columns and Tables. I like to
think of the data you load into Power BI as being a bit like raw cooking ingredients, and the measures you write being like a “recipe” to “cook” something up using the raw data. The recipe is repeatable – you can use it over and over again against the same ingredients to get the same result.
Benefits of measures include:
- Measures do not create duplications of your data. Conversely, both calculated columns and tables duplicate the data in Power BI.
- You write a measure once, and then use it many times.
- Each measure that references one or more columns can be given its own unique name making it easy for end users to find and use the business insights they need.
Creating Structure with DAX Queries
When you write DAX Queries in Power BI to produce a table, the process is
quite similar to T-SQL above. This is why many SQL professionals like to write
DAX queries. Here is a DAX query that could be considered equivalent to the
T-SQL Script below.
Believe me, writing measures and learning to write DAX is the secret sauce that will set the Power BI superheroes apart from the rest of the pack.
Filter First, Calculate Second
Chapter 10: AI for Business Users in Dataflow and Power BI Desktop
In chapter 10, Leila Etaati provides an overview of new AI capabilities and
features in Power BI service and Power BI desktop. First, she explained how
business users, using AI very easily, without writing any codes only with a couple of clicks. In this chapter, she shows two different possibilities of consuming AI. First how as a business user can analyze the text in the Power BI service, next part, she explains how to use some AI-powered visuals such as Key Influencer in Power BI Desktop
Step 1 – To create a new workspace, click on “Workspaces”, then click on “Create app workspace”. Now, on the new page, you can create a new workspace (pro or premium). Now you can create a new one by putting the name, description, and image for the workspace. So, choose the proper image, name, and description and click on the Save
Step 2 – Create a Blank Table and Put the text
Step 3 – Edit Data in Dataflow
Expand the cognitive services folder and you will be able to see four
different cognitive services
● Sentiment Analysis
● Keyword Extraction
● Language Detection and
● Image Tag
Sentiment Analysis is for identifying how much a customer is happy with
products. The value will range from 0 to 1. If the value is close to 1that means the customer is happy about the product, otherwise, if the value is close to 0 that means the customer is not happy about the product.
Image Tag in Power BI –
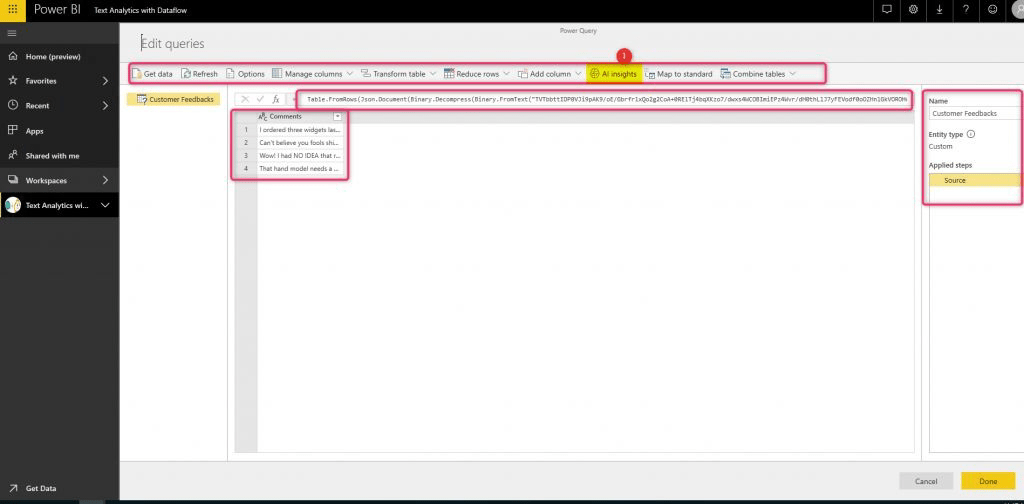
Image tag is another service in Cognitive Service that allows to extract the object in the image and for each detected object, it provides the confidence level.
In the new page delete the existing code and replace it with below code (you
should have your own image link).
let
Source = Table.FromRows({ { Web.Contents("image address 1") },
{Web.Contents("image address 2") }, {Web.Contents("image address 3") }, {
Web.Contents("image address 4") }}, { "Image" })
in Source
After loading the data, you should see the imported image as a column with
binary format.

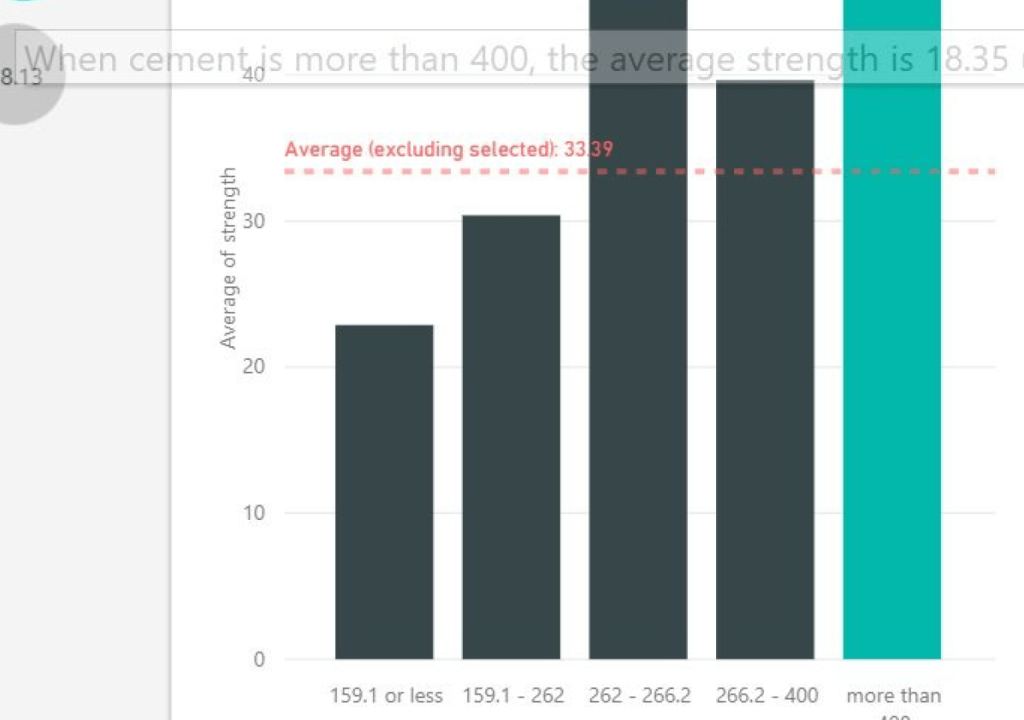
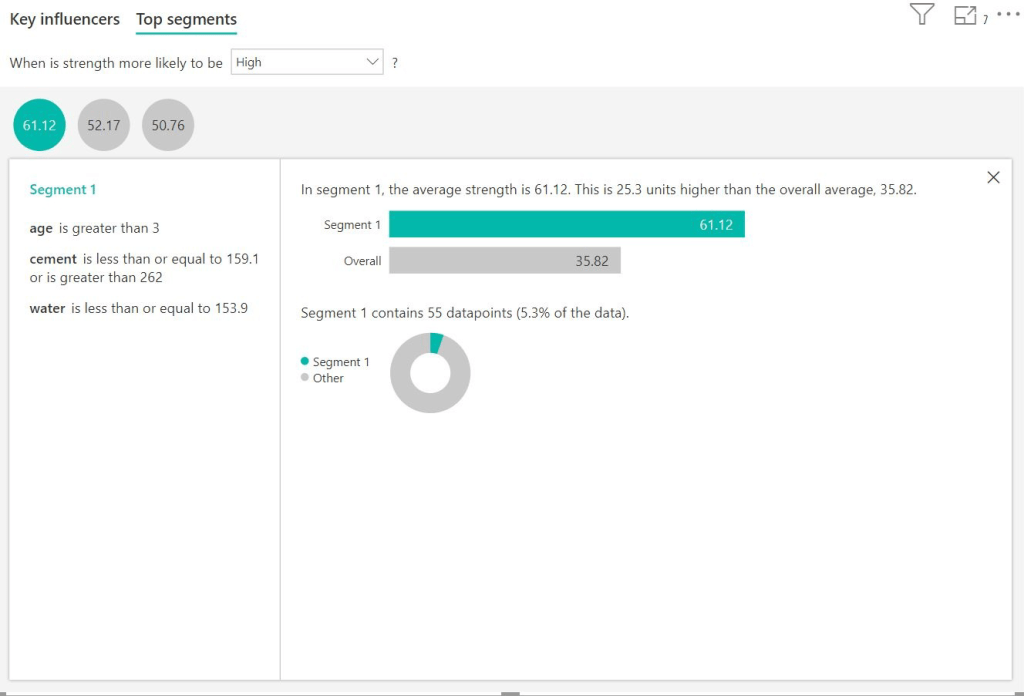
Key Influencer
- Interpret both Categorical and Numeric variables
- Provides a great clustering approach: find the natural grouping on data, and then visualize the main top cluster (segment) and also, it shows how a combination of factors affects the metric that you’re analysing.
- Explain the results: the visual provides a brief description of how it works
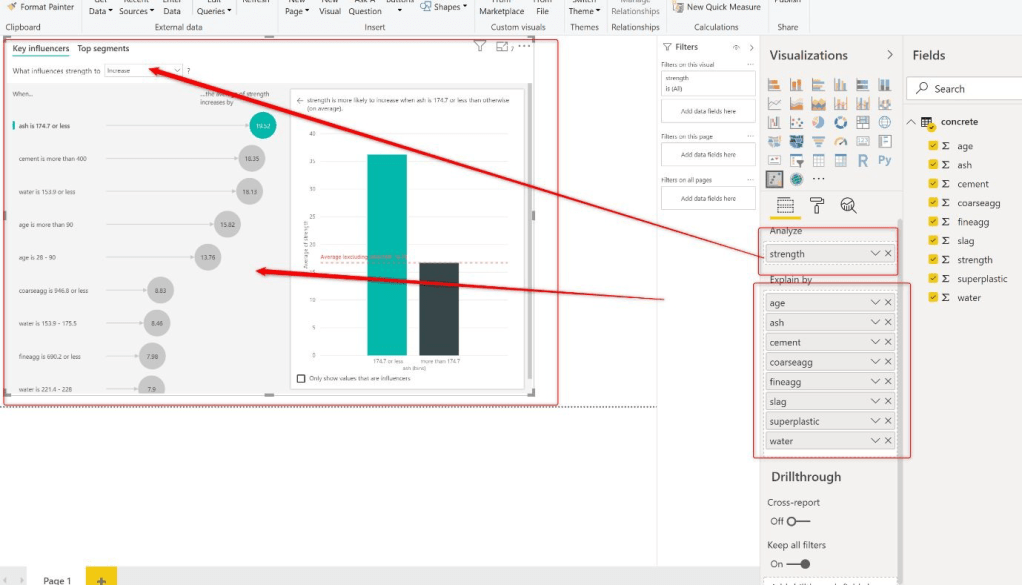
- As mentioned before, this visual employs a combination of algorithms. In categorial and regression analysis different algorithms are used.
- The first important point, the list of the factors are displayed in the left panel with specific order. The one at the top has most impact.
- There is another analysis tab named Top Segments. Click on the Top segment at the top and choose the first segment
Chapter 11: AI in Power BI Desktop
In chapter 11, Markus Ehrenmüller-Jensen describes some of the many
possibilities to leverage the use of Artificial Intelligence (AI) in Power BI
Desktop. He took Linear Regression and Text Mining as an example to show
you, how to make use of DAX, R, Power Query (M), Cognitive Serves and
Azure Machine Learning.
Linear regression is a quite simple mathematical formula to create e. g. a trend line for a measure over time. In our example, I will use simple linear regression for sales amount over order date.
Analytic Line
For certain visualizations, Power BI allows us to apply Analytics. In the case of a
line chart we can apply the following:
● Trend line
● Constant line
● Min line
● Max line
● Average line
● Median line
● Percentile line
Azure Cognitive Services
Azure Cognitive Services is Microsoft’s offer for so-called pre-trained models.
Microsoft’s data science team is developing and publishing an ever-growing
amount of different services, which are used internally as well (e. g. to localize
the online documentation at docs.microsoft.com).
“Pre-trained” means, that Microsoft took care of tuning the models. This guarantees a high level of quality for a lot of use cases.
Currently Azure Cognitive Services offers different features like decision-making, vision, speech, search, and language.
The latter offers services like Text Analytics, Translator Text, QnA Maker, Language Understanding, and Immersive Reader.
Chapter 12: Automated Machine Learning in Power BI
Among so many definitions, Machine Learning can be defined as: “The field of
study that gives computers the ability to learn without being explicitly
programmed” – Arthur Samuel (1959)
ML algorithms learn from historical data to build models that predict the
future. ML at its heart is a probabilistic, not a deterministic science because of
generalization based on probabilities. That means any ML model has a margin of error and accuracy level.
The role of a data scientist is to come up with a model that has the highest
level of possible accuracy of predicting the outcome of the new unseen data.
This chapter covers lot of advanced topics related to AI. Once I’m familiar with the concepts, I will provide the Titbits. Lets move to next chapter.
Chapter 13: Power BI REST API
Power BI service components can be configured and administered using its user interface on the web available at http://app.powerbi.com, however, sometimes automation is needed to perform repetitive tasks or integration.
Power BI Service gives you the user interface to administrative tasks but you can use the REST API in order to integration Power BI with your applications.
The Power BI REST API is available to developers to take advantage of when
you need to perform repetitive administration, including configuring and
integrating Power BI with external applications
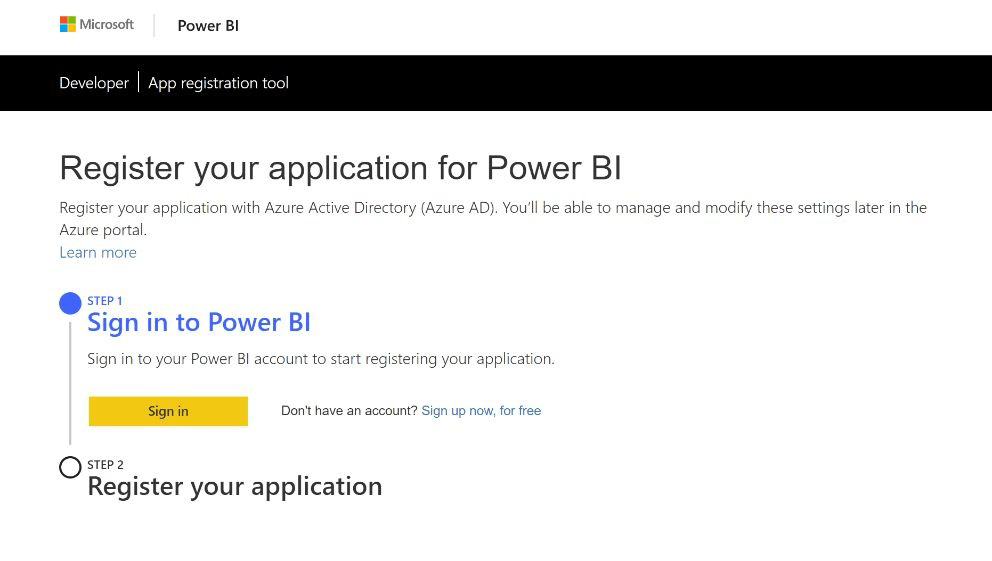
The first step is to register your application. This is a requirement because any
an application that wants to interact with the Power BI Service and with Azure must be registered and authorized in the Power BI and Azure tenants.
To start the registration process, navigate to https://dev.powerbi.com/apps.In this first step you must first login using your corporate Power BI account and must follow the instructions to register and authorize your application
The App Registration page requires the following information: your application name and the application type. For the application type you have two options:
● Server-side Web App: This use case is for applications that resides on a
server. In this case it can be web applications or mobile applications.
● Native App: This use case is for applications that will run on a specific
environment, for example a console application.
During the App Registration you must provide your application name and
application URL and redirect URL.
There are two ways to integrate Power BI into your application:
● Integration with a token: In this case your application is the one that
authenticates with the Power BI Service, all the authentication process is
done by the application, and end users do not even need a Power BI
Account.
● Integration without a token: In this case, when the users want to access
your application content, they will be prompted for a Power BI Account
for authentication.
If your application is going to use integration with a token you must create the application as Native Application Type, it doesn’t matter is the application you are creating is web-based, console or a mobile application.
The last step is the register your application, once you have selected all the
properties and permissions of your applications, you click the “Register” button and if everything is ok, you will receive a Client Secret and Client ID, copy & paste this information and save it, because you will need it in your code in order to interact with Power BI Service.
Another method to register your application is using the Azure Portal, to use this method you must go to http://portal.azure.com using this method gives your more control on your application and if you want you can always go to the Azure Portal and change the permissions of your application.
Chapter 14: Real-Time Streaming Datasets
In chapter 14, Manohar Punna introduces various streaming solutions available with Power BI Service. He takes you on a step-by-step implementation of these solutions using different scenarios. The learnings in this chapter give you hands-on experience in building real-time streaming solutions in Power BI.
- Power BI helps you build appealing visualizations of your data. With an ever-growing footprint of data, it is essential to get real-time insights into your data.
- These insights can be as simple as monitoring a single metric or as complex as viewing real-time sales performance across multiple locations.
- Power BI real-time streaming datasets enable you to stream data and update dashboards in real time.
- Any time-sensitive data can be a source of streaming datasets such as IoT sensor devices, social media sources, and service usage metrics
Problem:
For example, in a manufacturing factory, detecting an anomaly in the product
manufactured should be done before the product is packaged and sent. Whereas in the same factory, monitoring pressure levels are critical and need to be fixed within a few minutes.
Solution:
Microsoft Power BI provides real-time streaming datasets as a solution to this requirement. Streaming datasets can be created to collect the transmitted data and analyze them using real-time streaming visuals. These visuals can be real-time on dashboards and can also be used in building reports.
In Power BI, there are three types of real-time datasets:
● Push dataset
● Streaming dataset
● PubNub streaming dataset
Push Datasets
- Push dataset, as the name suggests, allows to push data into the Power BI
service. - When you create this dataset, Power BI provisions a database to host the data pushed into this dataset.
- This database is only accessible as a dataset in Power BI. There is no way to connect to this database directly.
- The data stored in the dataset can be used to build visuals in reports. These visuals can then be pinned to dashboards to display real-time data.
- Once you pin a visual created on a push dataset to a dashboard, you can also perform Q&A in natural language on the dataset. You can pin the resulting visual as a live tile on the dashboard.
- It is important to note that when you pin the live page that hosts the visuals created on real-time datasets to a dashboard, the data does not refresh in realtime on the live page.
Visuals created using real-time streaming datasets refresh in real-time on
dashboards only. The Power BI service triggers the refresh of a dashboard tile when the data refreshes on the real-time dataset.
Advantages & Disadvantages:
The main advantage of push datasets is to build visuals in reports similar
to standard datasets. The data is saved forever in the provisioned database.
Hence, the reports can be built to analyze historical data for in-depth
analysis in addition to real-time analysis.
The disadvantage of having to push data into a database is that the data
refresh is not instantaneous. You can expect to see a latency of 3-5
seconds for the data to appear on the visual on the dashboard from the
time data is pushed from the source.
Data ingestion is at the rate of 1 request per second with up to 16 MB per
request. The throughput is limited to 1 million rows of data per hour. If
your data is more extensive than these limits, it is recommended to push
aggregated data from the source.
Streaming Datasets
- A streaming dataset is the pure flavor of a real-time dataset. The latency is
minimal and is built only for real-time analysis. - The dataset is provisioned in Power BI using a temporary cache. This mechanism helps reduce the latency and provides near real-time data access in Power BI.
- As this is a temporary cache, the data is hosted up to one hour, hence providing a transient real-time trend for visuals like a line chart.
- The visuals can be created only on a dashboard using the Add Tile functionality.
- You cannot create a visual using this dataset in reports. All the report-specific functions like filtering and custom visuals are not available when using the streaming dataset.
- Streaming datasets are available under the custom streaming data option as a data source and are visible when you create a live tile on the dashboard.
Advantages and Disadvantages
The advantage of using a streaming dataset is that it provides very little
latency. There is no database to host the data, which reduces the latency of
writing and reading from a database.
The disadvantages are that there is no access to historical data, and there
are limited visuals that you can create on a dashboard using live tiles. The
data is saved temporarily for up to one hour.
Data ingestion is at the rate of 5 requests per second with up to 15 KB per
request. There is no throughput limit for streaming dataset, while the size
of the request is less than that of push dataset.
This limit is set because it targets scenarios where you would want to use streaming datasets to view data which is meaningful for real-time analysis as-is, like temperature readings or other sensor data to detect any spikes.
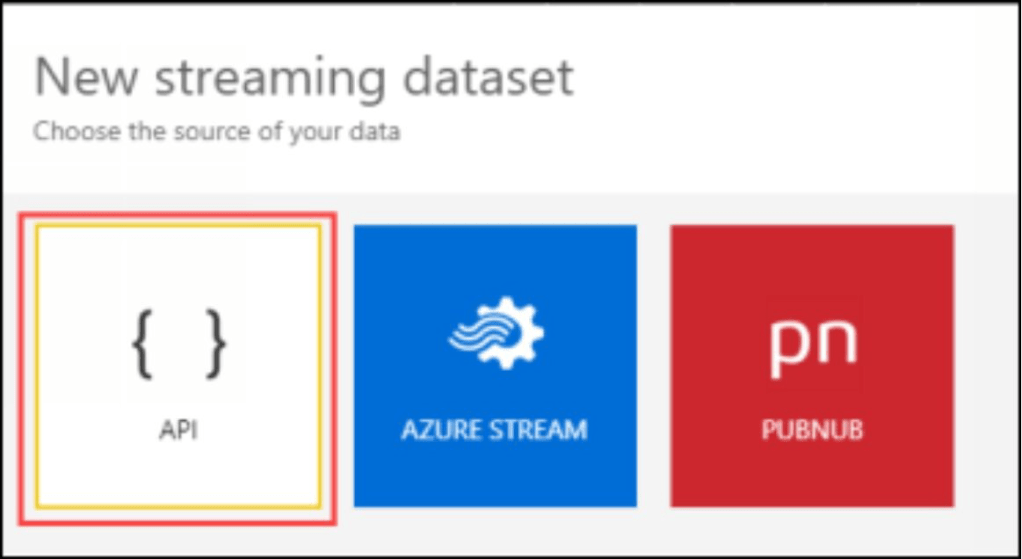
You need to follow the below steps to create a new real-time dataset:
- Click on any workspace in the Power BI portal.
- Click on Create and select the Streaming dataset
- Select API to create a Push or Streaming dataset using UI in the Power BI service.
- In the New streaming dataset screen, provide the Dataset name. Under Values from streaming, provide the columns in the dataset with an appropriate data type
The option Historic data analysis selection decides if the dataset is push or
streaming. If this option is selected, the data is saved forever in a database,
making it a push dataset. If you do not opt to select this option the dataset
is saved temporarily in a cache, making it a streaming dataset.
Chapter 15: Introduction to Conversation-Centric Design ™
In Chapter 15, Treb Gatte will guide you through designing your BI content so
that it is aligned to the business need. It’ll enable you to address two common problems in BI content development; ensuring you can manage scope easily and ensuring that the outcomes are aligned with where the end user should use the content.
The Conversation-Centric Design™ (CCD) process uses the user’s social
interactions to provide context and direction for the development of Business
Intelligence content
The CCD process leverages formal interactions as a starting point for BI content design.
These interactions are called client calls, meetings, projects, hallway
conversations, etc. Many of these interactions are formal in nature. They occur regularly, have a set attendee list and a set agenda
Prebuilding Phase – Detailed Conversation Centric Design process
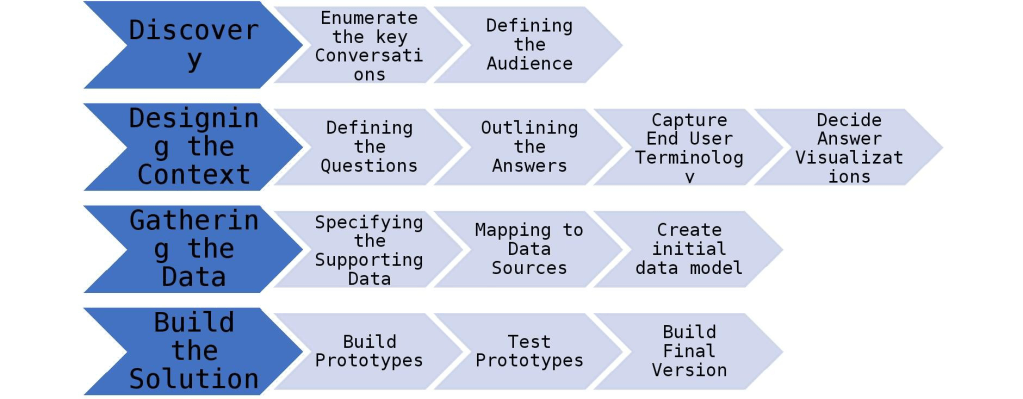
- Discovery Phase – The discovery phase provides the steps necessary to focus your efforts on the key conversations
- Scoping Phase – This use enables you to decide which conversations to invest in from a business intelligence perspective.
- Prioritization Phase – This use enables the Business Decision Maker to decide which conversations to address first. This aspect enables the BDM to get the biggest impact on the investment
- Status Phase – BDMs are usually not data professionals so providing status on data models, measures, and Extract-Transform-Load (ETL) processes without context, results in glassy-eyed looks, nods of the head, and zero understanding of what’s really happening. Providing updates relative to the business event, it helps the BDM understand where the impact of a given topic will lie. We should still take steps to make the process as clear as possible for the BDM.
- Audience Phase – Many business intelligence projects only consider the direct requirements of the requestor. However, once implemented more broadly, a flurry of activity results as other stakeholder needs are discovered and were not accommodated in the design. This can lead to expensive rework
Different Type of Charts
- Trending charts – Single & Multiple Line Chart
- Comparison charts – Column, Bar chart, Histogram, Pareto Chart
- Tables – Simple Table & Matrix Table
- Card / KPI – Card, Multi-Row Card, KPI
- Combination charts – Column & Line, Bar & Line, Area & Stacked Area Chart
- Relationship charts – Scatter, Bubble Chart, Spider Chart
- Relationship of Part to Whole – Pie chart, Donut chart,
- Composition charts – Waterfall Chart, Ribbon Chart, Funnel Chart
- Static Data – Rating, Gauge, Progress Chart, Pictorial Chart, Tombstones, Pictograms
- Hierarchical chart – Organisation, Decomposition, Flow chart, Pyramid Chart
- Timelines – Gantt chart, Timelines
- Geography Data Chart – Heat Maps & Bind Maps
- Misc representation – Word Cloud, Conditional formatting, Mind Map, Sticky Notes
Building Phase – Steps to follow
- Gathering the data
- Specifying the supporting data
- Mapping to data sources
- Create initial data model
- Build the solution
- Build Prototypes
- Test Prototypes
- Build the final version
The Conversation-Centric Design™ process streamlines the development of business intelligence data by providing a framework that helps you anticipate and address issues before they arise in the development process.
Once a solid base of content is in place, it also makes it easier to maintain that content over time as the requisite documentation is created as the content is developed.
Chapter 16: Understanding when to move to Power BI Premium
By having a deeper understanding of the Power BI Premium
features, it will allow you to make a more informed decision on looking to move to Power BI Premium.
1.Dedicated Performance
If I had to put this into an example, it would be you are sitting in an aeroplane as you to today. There are a lot of people in the aeroplane, but you are sharing not only the costs of having to fly the aeroplane, but you too are sharing all the components (engines, fuel, entertainment, pilots, air hosts, etc.) that make up the aeroplane.
Whilst when you move to Power BI Premium you are now flying on your private jet. Here you do not share anything with anyone else; the entire aeroplane is available for you to use as you so wish. The same applies to Power BI Premium, where you now have dedicated CPU and Memory.
There are three types of SKU – A SKU, EM SKU, P SKU.
The current way to purchase the Power BI EM or P Capacities is through the
Office 365 portal. This is because Power BI currently falls under the Office 365
stable of products. If you are looking to use the A Capacity that can be created through the Azure Portal.
A quick overview of what each of the Capacities is:
● EM – This is for Embedding Power BI into an application (An
application is your custom application that is not part of the Power BI
Service).
● A – This is also for embedding Power BI into an application (An
application is your custom application that is not part of the Power BI
Service). The difference here is that it is run from Azure. The advantage
of running it from Azure is that you get the Azure functionally to start and
pause the embedded capacity as is required. You can also scale up and
scale down the capacity as required.
● P – This is the Premium capacity where it can be used within the Power
BI Service and assigned to specific app workspaces, my workspace (users’
workspaces) or for the entire organization. One additional thing to note is
that the P Capacity can also be used for embedding into an application.
2. XMLA – End Points:
- XMLA endpoints is fancy terminology for meaning that you can connect to your Power BI Premium dataset with other tools such as Excel.
- The way I would explain XMLA endpoints from the standpoint of reporting is that any client tool that can currently connect to SQL Server Analysis Services (SSAS) Multidimensional will also be able to connect to Power BI Premium capacities.
- As it stands today July 2019, the XMLA endpoints are ready-only. In the future are plans for the XMLA endpoints will change to read-write, which will allow for a lot greater management of your Power BI Premium capacities.
- If you are looking to leverage other tools which have connectivity to SSAS
cubes such as Excel, Tableau, or others, then this is an option to consider.
3. Free Licenses
By using Power BI Premium, you can use the feature of free users who can view the content in an App Workspace that has been assigned to Power BI Premium (This only applies on the P SKU) .
What could also be considered is if there is a pricing breakpoint between the
number of users who need to view dashboards and reports when compared to purchasing Power BI Pro licenses. It is a good exercise to investigate as there might be some great cost savings.
4. Higher Refreshes
Currently, when using Power BI Pro, you are limited to 8 refreshes a day. When you have an App Workspace assigned to Power BI Premium you can then have up to 48 scheduled refreshes per day.
This means that during the core business hours (being 8 hours a day), you could refresh the dataset every 15 minutes.
5. Incremental Refresh
What incremental refreshing is, it will NOT refresh all the data, but rather
refresh the latest data? Which means that it will incrementally refresh the new or updated data. And not refresh the entire sales data table.
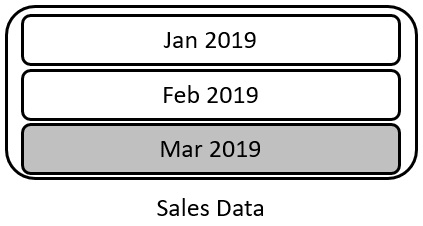
Using the above example if the current month we were in was Mar 2019, when configuring the incremental refreshing, it would only refresh the Mar 2019 portion of the sales data table
6. Faster Refreshes
Because you now do not have to refresh the entire dataset, but only a subset of the data it will refresh a lot faster. This is because if you had a table with three years’ worth of data, it would have to refresh 360 000 rows (The number is derived by assuming that each month has got 10 000 rows).
7. Fewer Resources are required
One of the things to always be aware of, as is typically the case when using
dedicated resources is that you only have a certain amount of resources that you can utilize. When using incremental refreshing, it will use a lot.
If you are using larger datasets and looking to get the data refreshed as
quickly as possible incremental refreshing could be a solution.
Another reason to decide to use Incremental refreshing is if you want the
refresh to consume fewer resources, mainly memory and CPU, this could be
a viable option to allow that to happen in a very efficient manner.
8. Dataset size larger than 1GB
- Power BI Premium allows you to work with datasets larger than the 1GB file size limit in regular Power BI.
- The Vertipaq engine, which compresses data in Power BI, is efficient, but some organizations have datasets that exceed the 1GB PBIX file size.
- This limitation exists in the Power BI Service, not the actual PBIX file.
- Power BI Premium can be a solution for handling large datasets in such cases. 🚀
9. Paginated Reports
Currently, a lot of organizations have invested a significant amount of time
in the creation and development of SQL Server Reporting Services (SSRS).
These were originally the first type of reports that allowed business users to
run their reports, change the parameters, and self-serv.
The SSRS reports were also very good at creating pixel-perfect reports, which allowed for the printing of reports for a lot of business users.
Not only that, but the business users could also export the data in the reports into multiple formats.
Finally, the SSRS reports could be set up with a schedule to allow the SSRS reports to be emailed to you. This meant that business users could get the SSRS reports either in the Inbox or from a folder location
Paginated then went Generally available on 09 June 2019
One of the major advantages of having paginated reports in the Power BI
Service is that you now have one central location for all the reporting
requirements in your organization.
You could also look at using the Power BI Report Server which is the On-Premise Version of Power BI and SQL Server Reporting Services (Paginated reports)
Paginated reports also use existing features and shared and certified datasets, which can be consumed by paginated reports.
Having a shared dataset, means that both Power BI reports and paginated reports will be able to use a single data source for multiple reports
10. Geographic Distribution
What geographic distribution means is that you can physically host your data in a Power BI Premium App workspace in another geographic location
Data sovereignty is another word for ensuring that your data is hosted in the
country or location which has been defined by a company or country regulations.
This often happens when certain countries have defined that all data must reside within their borders.
If you are a global organization and have users around the globe and have
transactions from multiple countries where the data must reside in the country where the data was transacted, this is another great option. This is where having the geographic distribution feature is valuable
11. Performance
Another advantage of looking to use geographic distribution is that if there is
any maintenance or updates required to reports, they could be done in an App Workspace whilst those users are not at work.
This allows for additional testing and ensuring that the reports and dashboards are updated and ready for those users when they get into the office the following day
12. Dataflows
Dataflows in Power BI are a way to unify data from different sources using
Power Query Online. All the data is stored within Power BI (Azure Data Lake
Gen2) and allows other users to consume dataflows within their reporting
Advantages of Dataflows:
Linked Entities – When the linked entity is refreshed, it does not have to go back to the source data, but rather it gets the data from the existing dataflow. This allows for a much faster refresh of the data because it simply gets the data from the dataflow that is already stored in the Power BI Service
One of the key features of a linked entity is that as a business user, you do not
have to understand how the linked entities pieced (how they relate to each other) together, and in what order they need to be refreshed.
All of this is handled by Power BI Premium, and if there is an underlying
dataflow that must be refreshed for your linked entity to be refreshed, Power BI Premium is aware of this and will do it for you automatically.
13. Advanced AI features
AI is becoming essential in a lot of organizations, and when looking to use
Power BI Premium, more AI features are being released, which allows for easier integration with your existing data assets, which allows organizations to quickly use AI for better data-driven decisions
Chapter 17: Incremental refresh
Incremental refresh offers a simplified approach to loading only the most recent changes to the data making data loads faster and more reliable while consuming fewer resources. In this chapter, we cover how to set up and maintain Incremental-refresh for your power BI model.
Incremental Refresh was added to the Power BI service to reduce the time taken to refresh a dataset by merely refreshing only the most recent data and not the entire dataset. By reducing the amount of data that needs to be re-loaded, refreshes take not only less time but also consume fewer resources doing it.
How does it works:
Incremental Refresh implements partitioning where a partition is a small part of a larger table, each partition is assigned a range of values usually by the date that gets stored in that partition.
The power of partitioning is that the Power BI service can refresh a single partition or even a group of partitions instead of the entire table as we see in the Power BI service currently.
Benefits of this incremental refresh are:
- Faster Refreshes:
As each partition contains only a small percentage of the total rows, we
reduce the number of rows that need to be imported. - Fewer resource required
As only a small portion of the data is loaded the number of resources
required from both the source system and the Power BI service is reduced
including locks on source systems, CPU, and network resources. - More reliable processes
As Power BI datasets often use core business systems as their source, long-running queries may affect their performance. By reducing the number of rows, we improve not only the speed of the load but also reduce the risk of query timeouts and other network-related issues.
Requirements of Incremental refresh
To be updated soon
Chapter 18: Report Server Administration
To be updated soon
Chapter 19: Governance
To be updated soon
Chapter 20: Architecture of a Power BI Solution in an Enterprise Environment
To be updated soon
Chapter 21: A Power BI-only Solution for Small Organizations
To be updated soon
Discover more from LR Virtual Classroom
Subscribe to get the latest posts sent to your email.
