Admin Portal of the Power BI is the key controller and one needs to understand the features, functionality, capabilities, and do’s and don’ts.
So, here’s the post about the Admin Portal. There we go, let’s get started.
Before that Power BI Administrator role will be renamed to Fabric Administrator
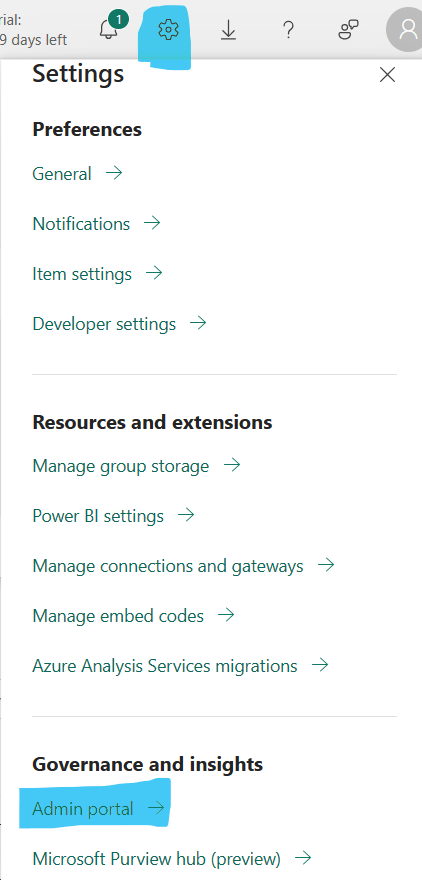
1. How to access the admin portal in Power BI Service – Settings – > Admin Portal under Governance & Insights.
ADMIN MONITORING WORKSPACE
You can access this under workspace in Tenant settings.
2. The Admin monitoring workspace is designed to provide admins with monitoring capabilities for their organization. Using the admin monitoring workspace resources, admins can perform security and governance tasks such as audits and usage checks.
3. To use the admin monitoring workspace, you need to be an admin with one of these roles.
- Microsoft 365 Global administrator
- Fabric administrator
By default, the Office 365 administrator is the Power BI administrator.
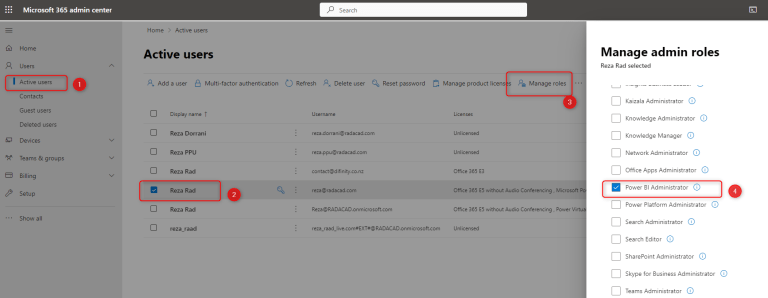
However, You can add a specific Power BI administrator by selecting the Power BI administrator role in Office 365 Portal. Here are the details of assigning a Power BI administrator role to a user.
- Login to http://portal.office.com with an Office 365 administrator account. Go to the admin panel.
- Find the user in the list of active users, and select it from the list.
- Assigning Power BI Administrator role
- Then click on Manage Roles.
- Under Admin center access, expand the Show all by category, and then from the list, select Power BI Administrator.
- You can also use some PowerShell scripts to assign the Power BI Administrator role to a user.
4. Users that are not admins, and do not have a Global administrator or Fabric administrator role, can’t see the admin monitoring workspace at the top of their list of workspaces.
Such users can only view the admin monitoring workspace by navigating to it’s URL after they’ve been given viewer permissions by an admin.
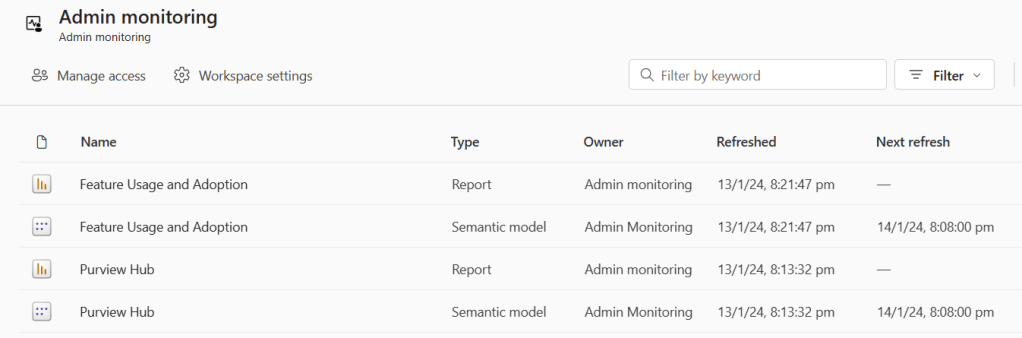
5. The feature usage and adoption report has three pages:
- Activity Overview – Provides a bird’s eye view of activities and usage across the entire organization
- Analysis – Visualizes data across multiple activity dimensions
- Activity Details – Displays detailed information on specific or multiple capacity or workspace activities
6. Use the Activity Overview page to find out:
- What are the daily activities and user trends?
- Which capacities and workspaces are the most active?
- View activities in your organization.
- View activities in your organization by users or top active user.
7. The Activity Details page shows information related to specific or multiple capacity or workspaces activities.
- Creation time – The time the activity was registered
- Capacity name – The name of the capacity that the activity took place in
- Capacity ID – The ID of the capacity that the activity took place in
- Workspace name – The name of the workspace that the activity took place in
- Workspace ID – The ID of the workspace that the activity took place in
- User (UPN) – The user principal name (UPN) of the user who created the activity
- Operation – The name of the operation
- Total of activities – The number of times the activity was registered
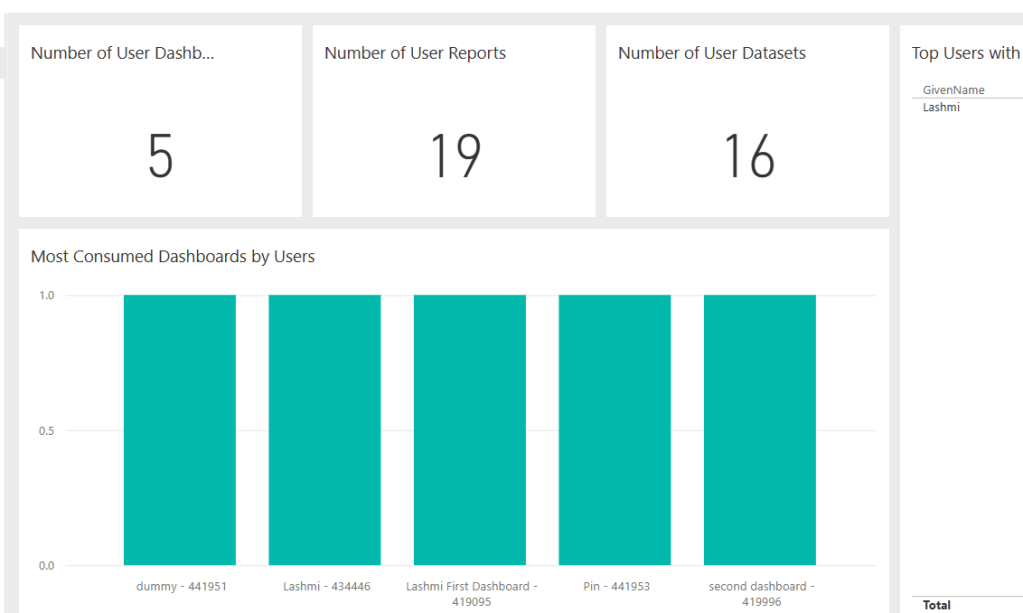
8. Feature usage report sample screenshot below from Admin workspace
Homepage of Admin portal page
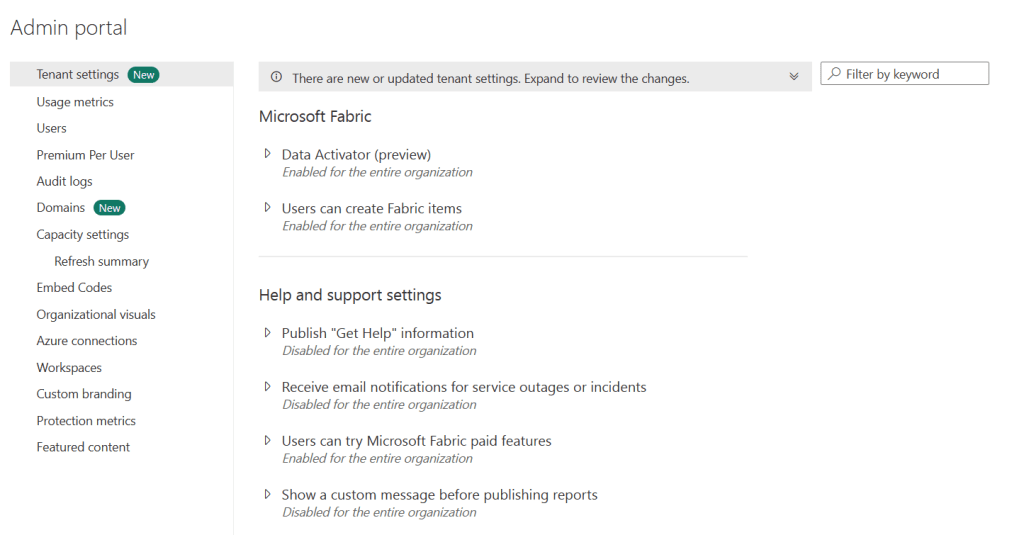
Below is the list of options in the admin portal.
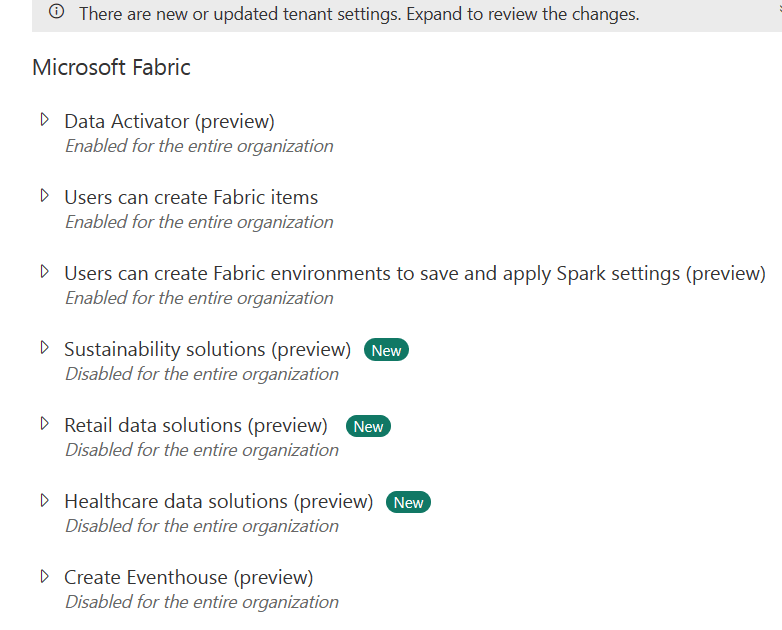
1. Tenant settings – Lot of settings to explore. Questions will come from the tenant settings.
2. Usage metrics – List of all the dashboards, reports, datasets, users etc
3. Users
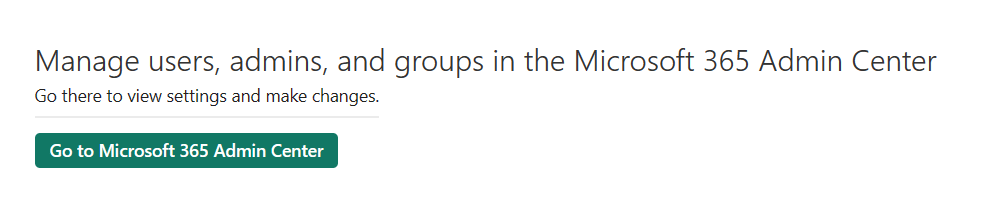
Manage users, admins, and groups in the Microsoft 365 Admin Center.
You manage Power BI users, groups, and admins in the Microsoft 365 admin center
4. Premium per user
Has the option of automatic page refresh, dataset workload settings, XMLA endpoint etc.
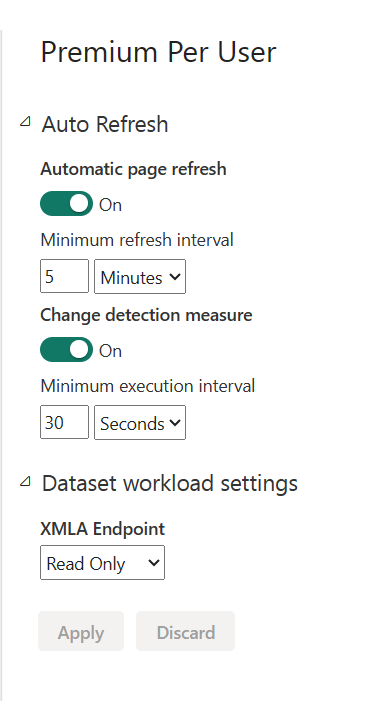
- AUTOMATIC PAGE REFRESH: Admins can manage the auto refresh and semantic model workload settings that are shown to users and their default values.
- MINIMUM PAGE INTERVAL AND MINIMUM EXECUTION INTERVAL – The settings can be changed here.
- XLMA Endpoints – The XMLA functionality is limited to Premium licensing – Read , Read-Write, Off.
- The read-only connection will enable you to read data from the dataset (Which can be useful for monitoring and querying), and the Write connection enables you to apply changes to the dataset (such as adding calculation groups or object-level security to the Power BI dataset).
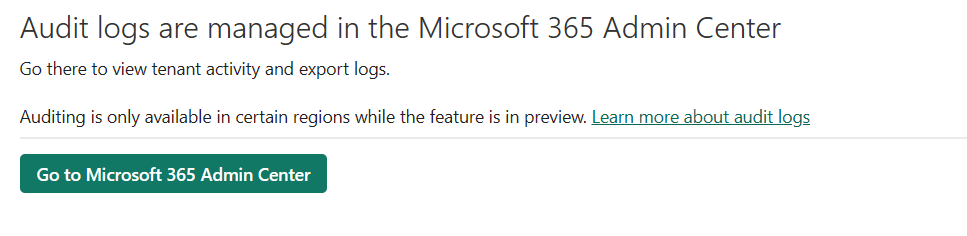
5. Audit logs
Audit logs are managed in the Microsoft 365 Admin Center.
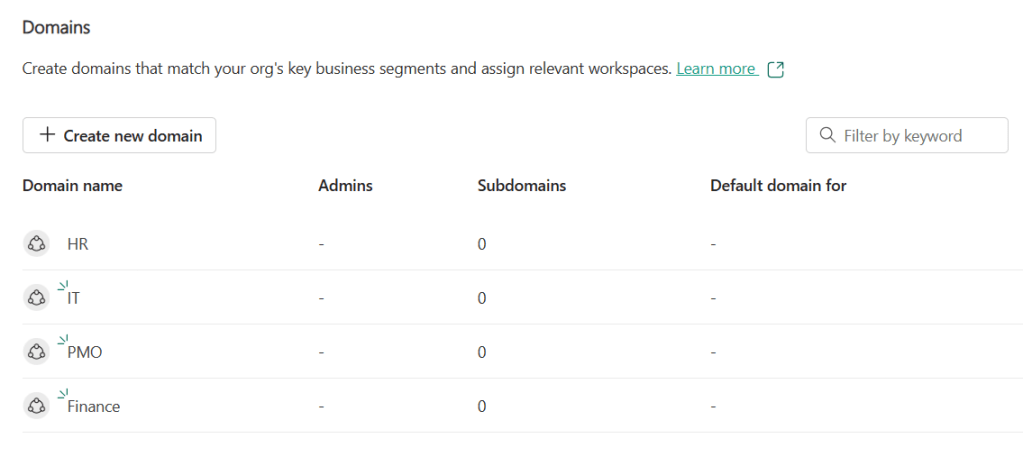
6. Domain
- Organize your tenant with domains.
- Domains help teams in your org find data they need, and make governing your tenant easier.
- Create your own domains like ‘Finance team’, or ‘HR’, then assign relevant workspaces to them
7. Capacity settings
Power BI Premium – Purchase Premium capacity, an add-on to Power BI Pro, to scale your BI solutions and easily distribute content with everyone in your organization.
Power BI embedded- Try Power BI Embedded for your analytics solutions. A single API in a familiar environment on an open and extensible platform.
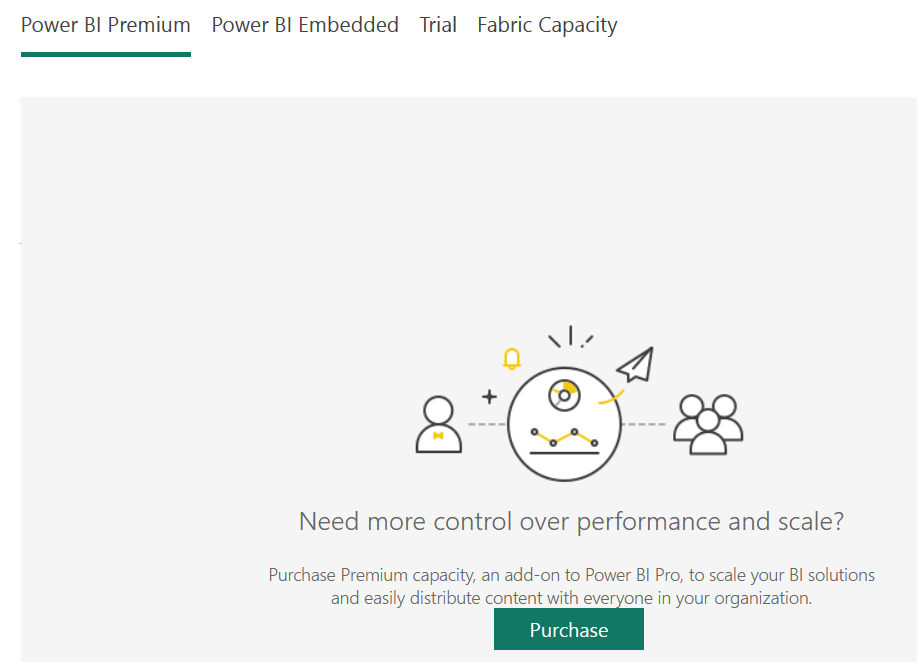
Trial – Try before you buy! Sign up for a free trial of our paid, premium features and see the value they can add to your experience.
Fabric capacity – Purchase a Microsoft Fabric capacity to distribute content across your organization and scale your business intelligence solutions.
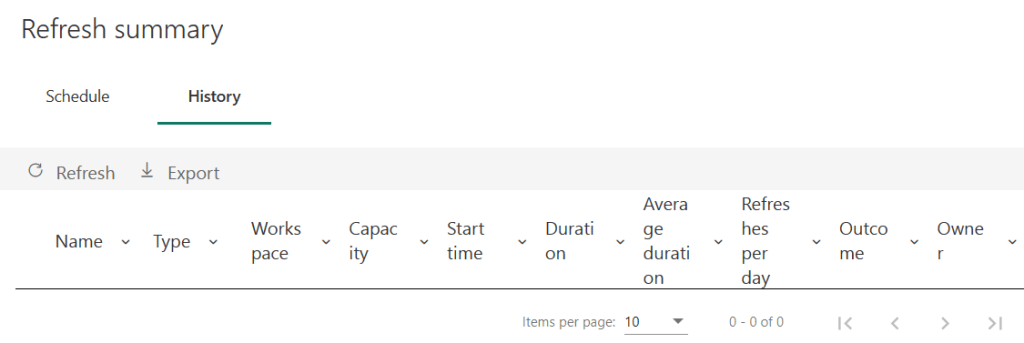
8. Refresh summary
- The refresh summary admin settings page lets you view your capacity’s refresh history.
- You can also export the refresh history, and view details related to a specific refresh.
Below are some settings that you can configure when managing your organization’s capacity settings:
- Create new capacities
- Delete capacities
- Manage capacity permissions
- Change the size of the capacity
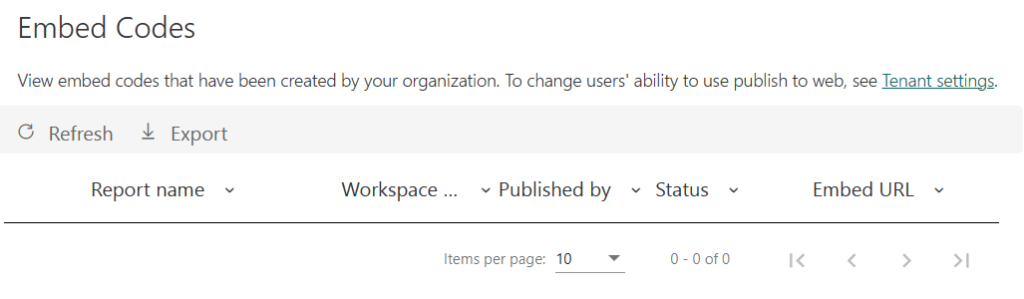
9. Embed codes
View embed codes that have been created by your organization.
To change users’ ability to use publish to web, see Tenant settings.
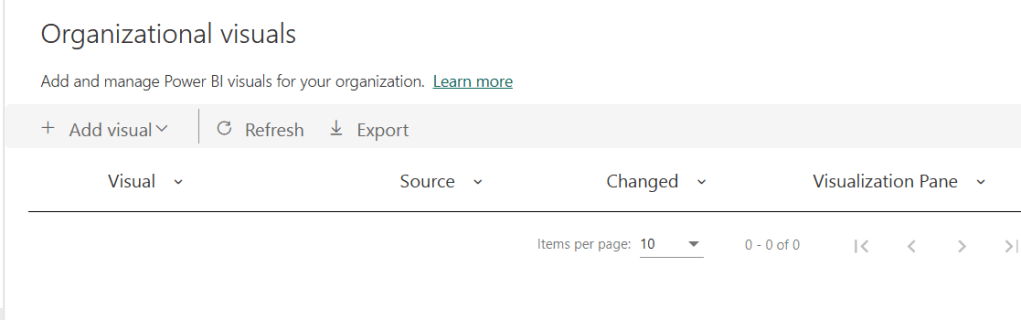
10. Org visuals:
The organizational visuals admin setting allows you to manage the list of Power BI visuals available in your organization.
Add visual from File or App Source
File – Choose a .pbiviz file – Select a visual file to upload.
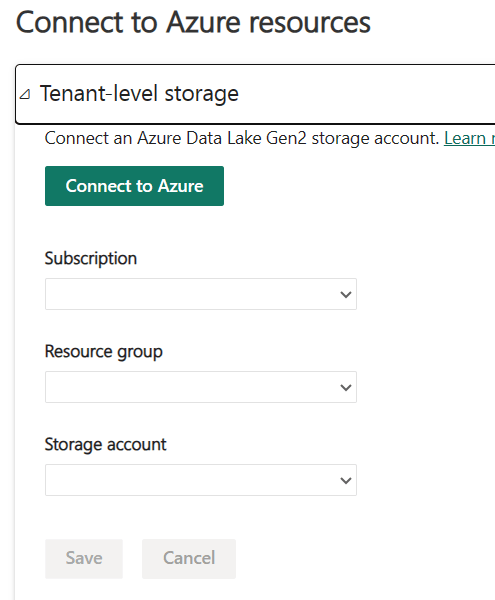
11. Manage Azure connections
The Azure connections admin settings connect Azure services to Fabric.
Using these settings, you can store your dataflows in your organization’s Azure Data Lake Storage Gen2 (ADLS Gen2) account.
12. Workspaces:
You can govern the workspaces that exist in your organization on the Workspaces tab in the Admin portal.
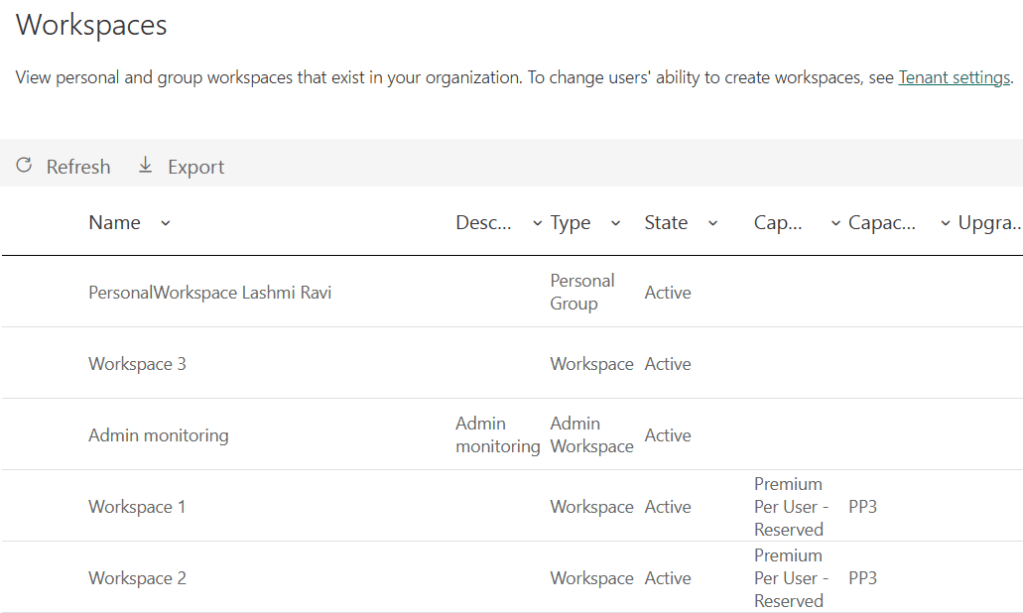
| Column | Description |
|---|---|
| Name | The name given to the workspace. |
| Description | The information that is given in the description field of the workspace settings. |
| Type | The type of workspace. There are two types of workspaces: |
| State | The state lets you know if the workspace is available for use. There are five states, Active, Orphaned, Deleted, Removing, and Not found. For more information, see Workspace states. |
| Capacity name | Name given to the workspace’s capacity. |
| Capacity SKU Tier | The type of license used for the workspace’s capacity. Capacity SKU Tiers include Premium and Premium Per User (PPU). For more information about capacity tiers, see Configure and manage capacities in Premium. |
| Upgrade status | The upgrade status lets you know if the workspace is eligible for a Microsoft Fabric upgrade. |
13. Custom Branding
Customize the look of Power BI for your whole organization – https://powerbi.microsoft.com/en-us/blog/announcing-custom-branding-for-your-organization
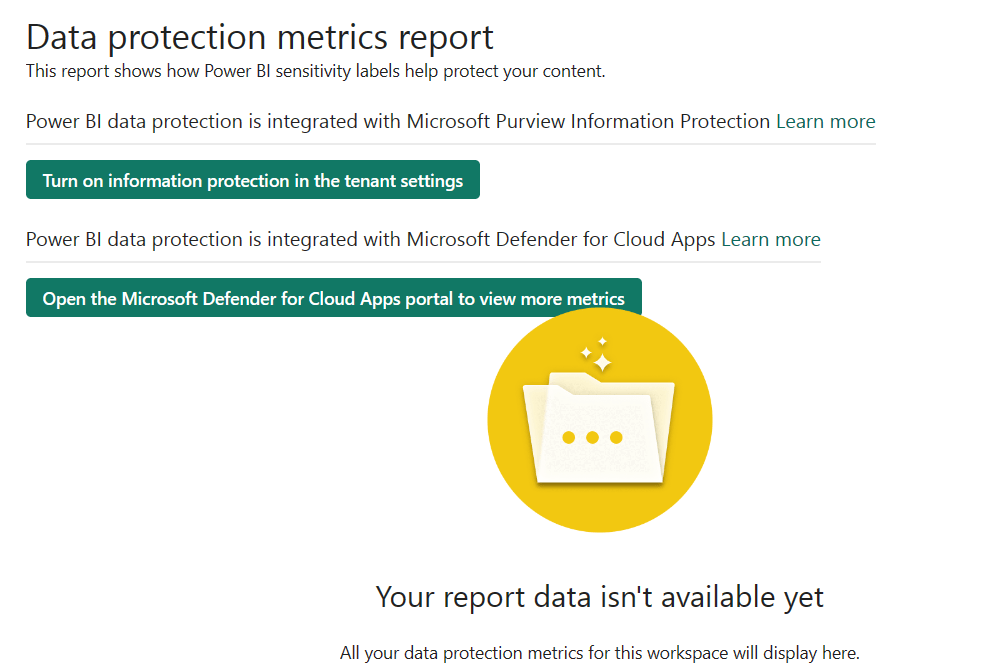
14. Protection Metrics
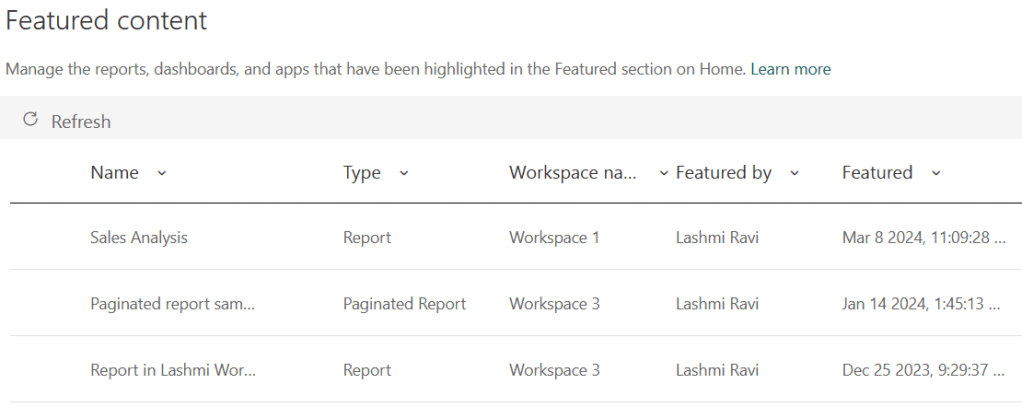
15. Featured Content
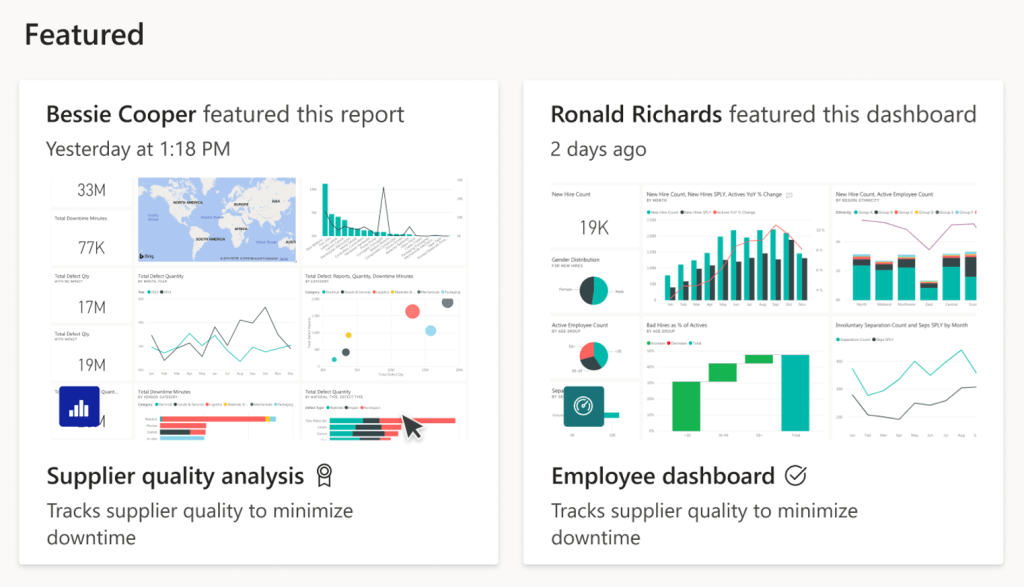
You can feature dashboards, reports, and apps so they appear in the Recommended section of your colleagues’ Power BI Home page in Simplified view, and in the Featured section in Expanded view
Featuring content is especially useful for onboarding new employees to Power BI.
To feature dashboards and reports, you need to have the Admin, Member, or Contributor role in a workspace.
To feature the app itself, you need to have the Admin or Member role in a workspace.
You decide which content they see first. Add descriptions and small thumbnail images to help them find what they need.
The content has to be in a workspace that they have access to
Thats a wrap. Check out detailed post on Tenant Settings in Power BI soon.
Discover more from LR Virtual Classroom
Subscribe to get the latest posts sent to your email.
