As a PMO lead, you know how quickly project data can become overwhelming. Dashboards help you step back and see the full portfolio – progress, risks, and trends – while leaderboards zoom in to energize teams by highlighting who’s excelling in day-to-day execution. Both tools are powerful, but they serve very different purposes. Let’s break it down simply so you can use the right tool at the right time.
What They Are
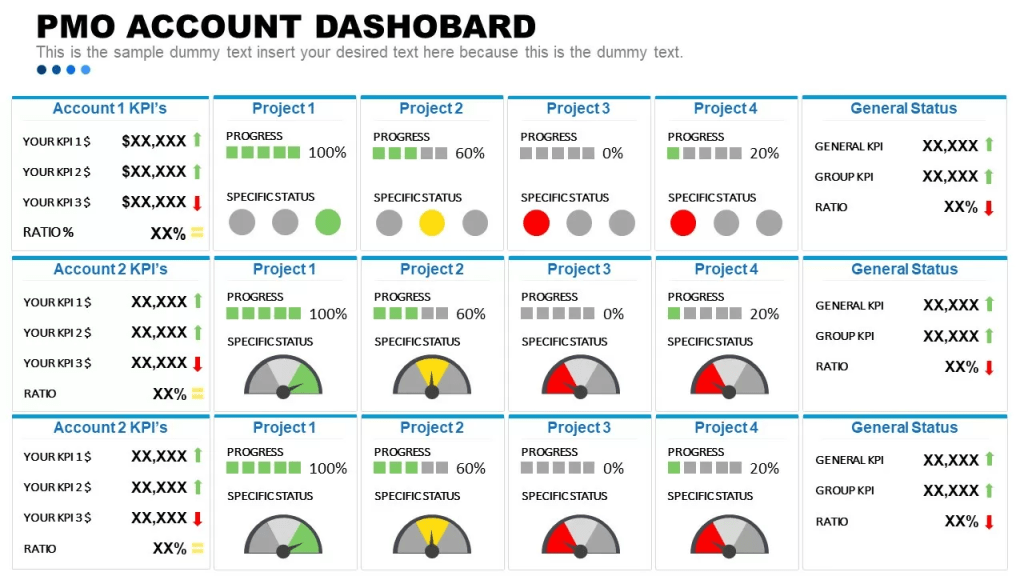
Dashboards consolidate high-level project and portfolio metrics such as overall progress, budget health, and risk exposure – into a single, easy-to-scan view. They are designed for monitoring, decision-making, and early issue detection.
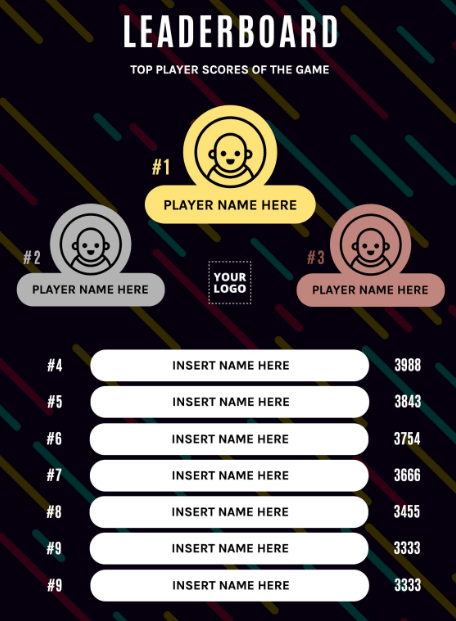
Leaderboards, on the other hand, rank individuals, teams, or workstreams based on specific, controllable actions. Their main goal is motivation. By making performance visible, leaderboards encourage focus, accountability, and friendly competition.
How They Differ
Dashboards explain what’s happening; Leaderboards influence behavior.
Here’s a quick side-by-side comparison:
| Category | Dashboard | Leaderboard |
|---|---|---|
| What it shows | Big-picture metrics like completion rates, budget health, and resource utilization | Ranked individual or team performance on specific activities |
| Who uses it | PMO leads, managers, and executives | Project teams and individual contributors |
| Best for | Portfolio oversight and strategic decision-making | Driving engagement, healthy competition, and quick wins |
| Data freshness | Real-time, but typically reviewed on a set schedule (weekly or monthly check-ins) | Real-time and always visible, meant to be glanced at throughout the day |
| How it is used | Pulled up intentionally when a manager or exec needs to assess status or make a call | Displayed prominently (wall screens, team channels) so it stays top of mind |
| Primary focus | Project and portfolio health as a whole | Individual and team contribution relative to peers |
| Depth of data | Broad and layered: KPIs, timelines, budgets, risks, and dependencies in one place | Narrow and focused on a single metric or activity to keep it readable at a glance |
| Emotional tone | Analytical and neutral | Motivating and competitive |
| Core value | Insight and control | Momentum and accountability |
Dashboard KPIs for PMO Oversight
Use dashboards to answer “Are we healthy?” at a glance:
- Project % complete – Are we progressing as planned?
- Tasks overdue – Where are delays starting to form?
- Budget used vs. planned – Are we overspending or underutilizing funds?
- High-risk items – What needs leadership attention now?
- Milestones at risk – What could slip next?
Leaderboard Metrics for Team Engagement
Leaderboards work best with metrics teams can influence daily:
- Tasks completed today – Highlights momentum and effort.
- Milestones hit this week – Shows delivery velocity.
- Top Key Issues resolved – Rewards problem-solving.
- Top 5 employees with most completed tasks – Recognizes high performers.
- Top 5 employees with most overdue tasks – Signals where support is needed.
- Workstreams ranked by completed tasks – Compares team throughput.
- Workstreams with most overdue items – Flags execution risks early.
- Top idea submitters – Encourages innovation and ownership.
Gamification Tips for PMO Initiatives
Leaderboards become especially powerful when paired with light gamification – enough to motivate, not overwhelm.
Rank teams on initiative-focused metrics to spark friendly rivalry. Keep rewards simple: public recognition, coffee vouchers, or team lunches often work better than expensive incentives.
Effective Gamification Metrics:
- Most ideas submitted (creativity boost)
- Training hours completed per team member (skill building)
- Tasks completed today (daily execution)
- Number of automations created (efficiency gains)
- Process improvements suggested (continuous improvement)
- Cross-team collaborations initiated (breaking silos)
- Documentation updates completed (knowledge sharing)
- New tools or skills learned (capability growth)
- Efficiency gains achieved (time saved or waste reduced)
- Peer-voted contributions (team recognition)
Add badges for weekly streaks, monthly bonus points, and sprint-based resets to keep things fresh and avoid burnout.
Common Pitfalls to Avoid
Even good tools can backfire if misused:
- Over-ranking everything: Not all work should be competitive – collaboration still matters.
- Using leaderboards for punishment: Public shaming kills trust; use rankings to support, not blame.
- Too many metrics: More than 5 metrics per view usually reduces clarity.
- Static dashboards: If data isn’t current, leaders stop trusting it.
When to Use Each
- Use dashboards in PMO and steering committee meetings to review portfolio health – burn rates, risks, and milestone status across all projects.
- Use leaderboards during sprints or initiatives – ranking teams on story points completed or issues resolved to create momentum before deadlines.
- Blend both by embedding a small leaderboard inside a dashboard to connect strategic oversight with team-level energy.
Quick Start Tips
- Start with 3–5 metrics every week and keep adding once the team get into the momentum.
- Use tools like Excel, Jira, Power BI, Tableau, or Azure DevOps for live updates.
- Pilot with one team or project for a week.
- Gather feedback, adjust metrics, and scale gradually.
When done right, dashboards give you confidence and control, while leaderboards give your teams energy and focus. Together, they turn data into action – without adding complexity.
Discover more from LR Virtual Classroom
Subscribe to get the latest posts sent to your email.
