
When you learn any tool, it is foremost important to know the user interface of the tool.
It will help you in many ways as listed below. This is my personal experience of learning.
- You will know directly or indirectly the features of the tool, in this case, Power BI.
- You will understand the functionality of the tool.
- It will help you to navigate the tool better so quick turnaround time.
- You will know the dos and don’ts of the tool or the best practices to follow while using the tool.
- It will also help to solve the problem or know different use cases, a particular feature or function can be used.
Here’s the post with just detailing the complete user interface of the Power BI Service.
This post helped to know many hidden navigations which I wouldnt have explored. So, lets get into the tool.
Homepage of the Power BI Service is as below:
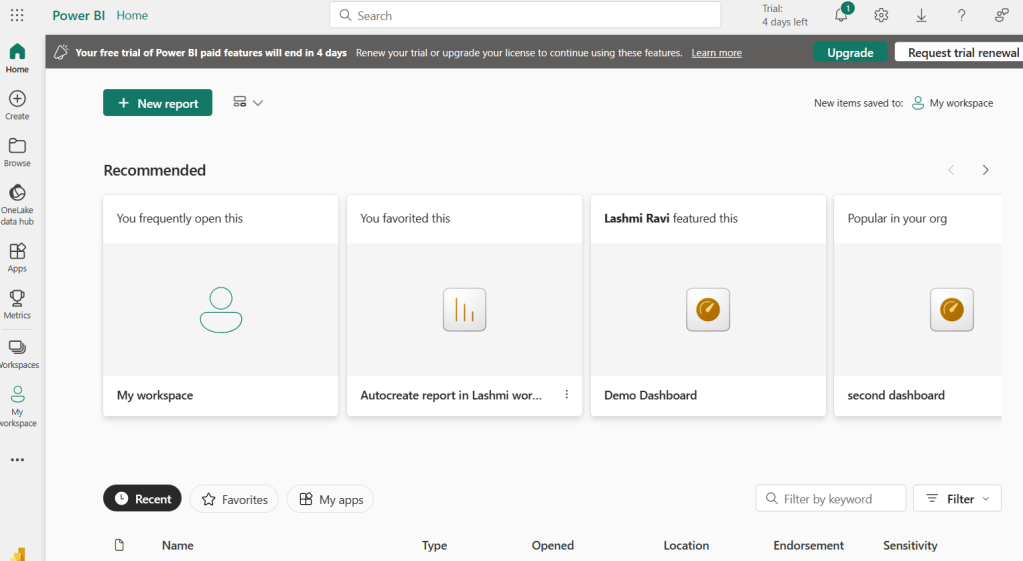
- Did you notice the buttons on the left -> Home, Browse, One Lake Data Hub, Apps, Metrics, Workspaces
- First, on the screen you look at are the recommended links. All these are based on frequently assessed by the user.
- Recent, Favourite options are available at the bottom.
- You also have the option to filter by keywords.
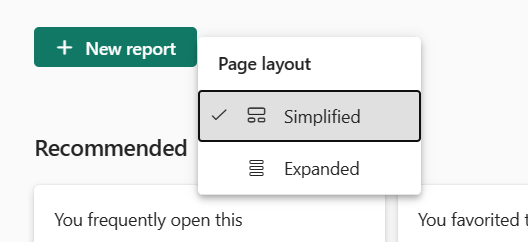
- There are two-page layouts – Simplified and Expanded
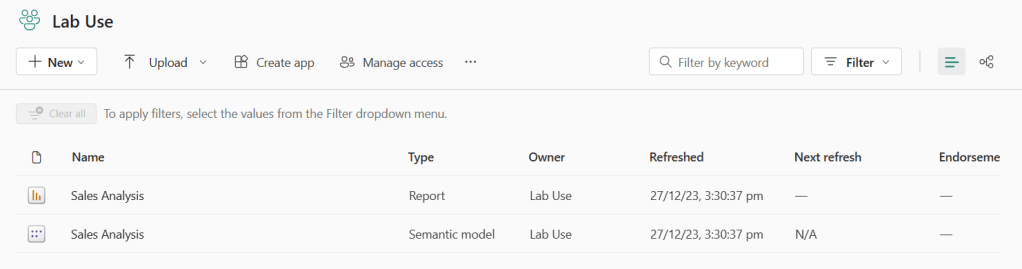
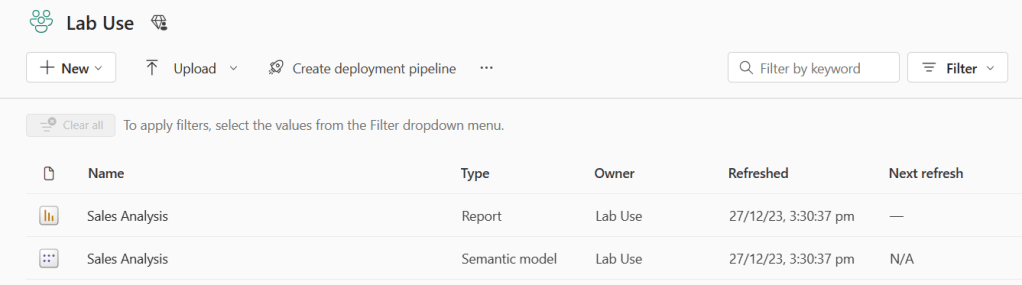
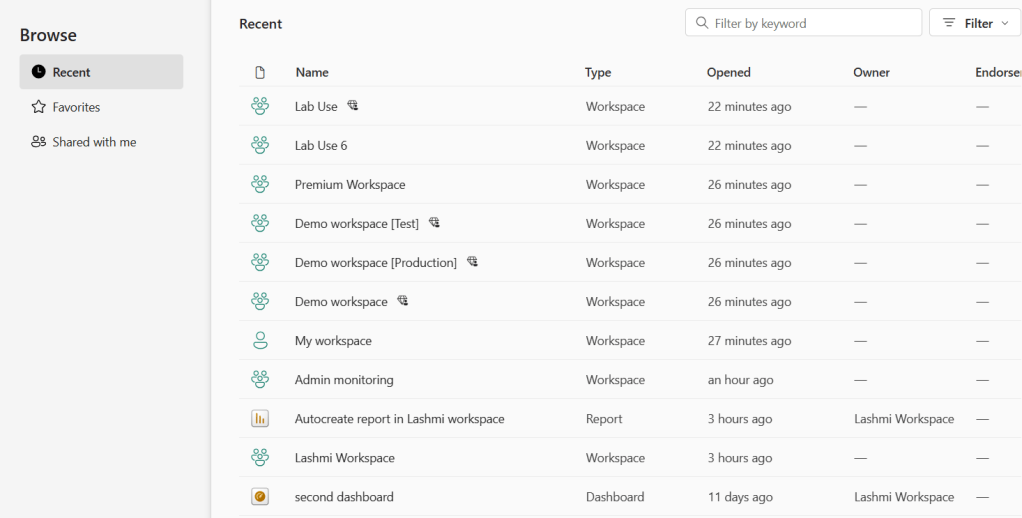
6. Below is the list of recent list. It contains Name, Type, Open, Location, Endorsement, and Sensitivity.
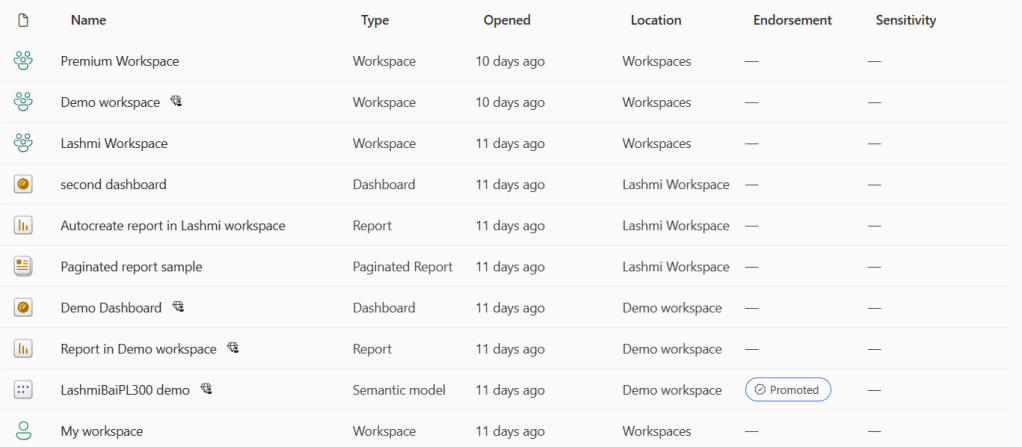
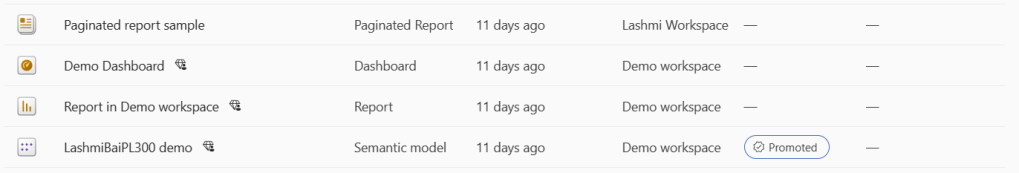
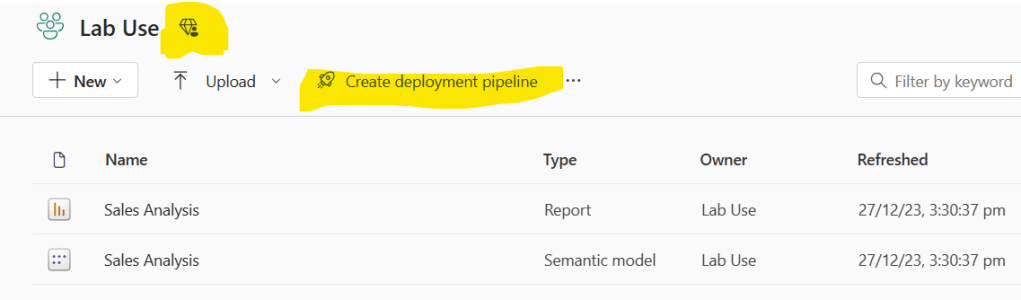
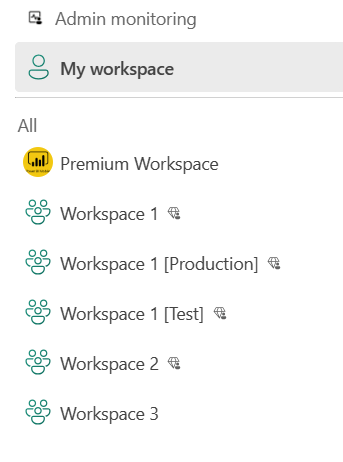
7. If your workspace is premium then you get the diamond icon next to it.
8. Did you notice, that Dataset is renamed the Sematic model.
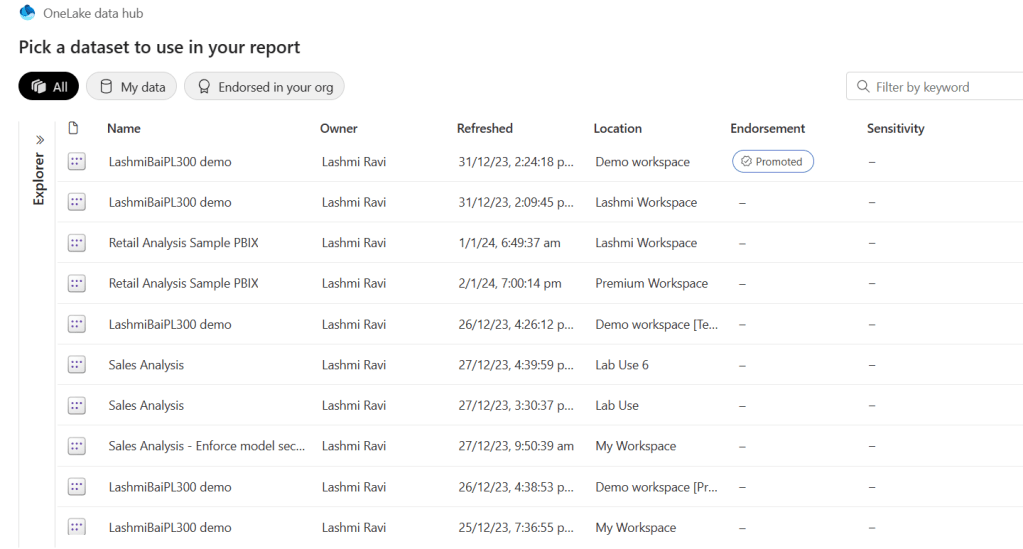
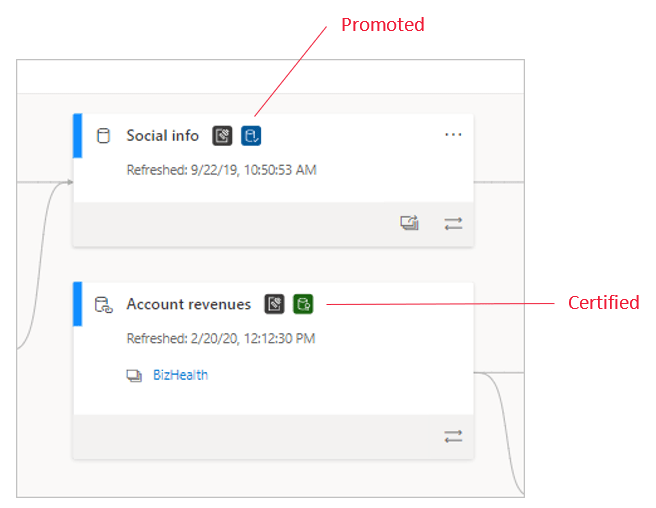
9. If the dataset is promoted, you find it as Promoted. The other option is certified.
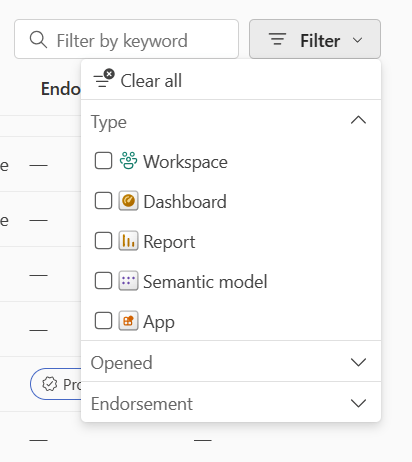
10. Filter options are given below. You can open by the Type, Opened, or based on endorsement.
11. The type is Workspace, App, Dashboard, Report, Semantic Model
12. Users who are granted access to a report are granted access to the entire underlying semantic model unless row-level security (RLS) limits their access. Report authors can classify and label reports using sensitivity labels.
13. What you see at the topmost bar is the Home button, Search bar, License type, Notifications (Bell icon), Download button (Down arrow), Question mark, Feedback, and finally My Profile

14. Ok. So what you can download from Power BI service?
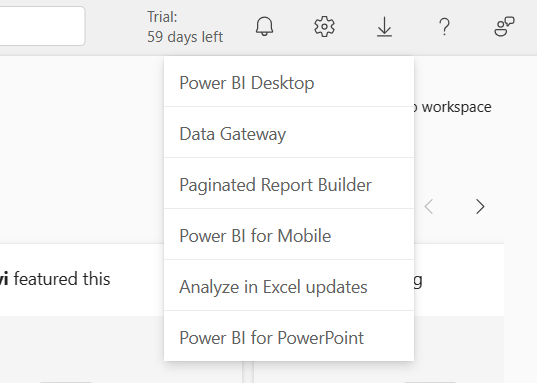
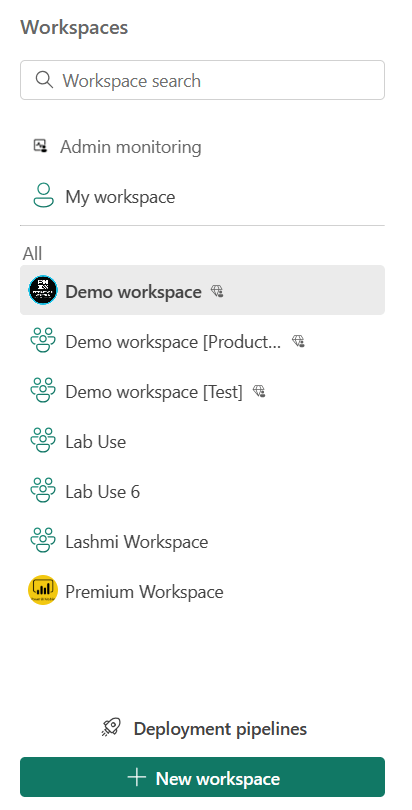
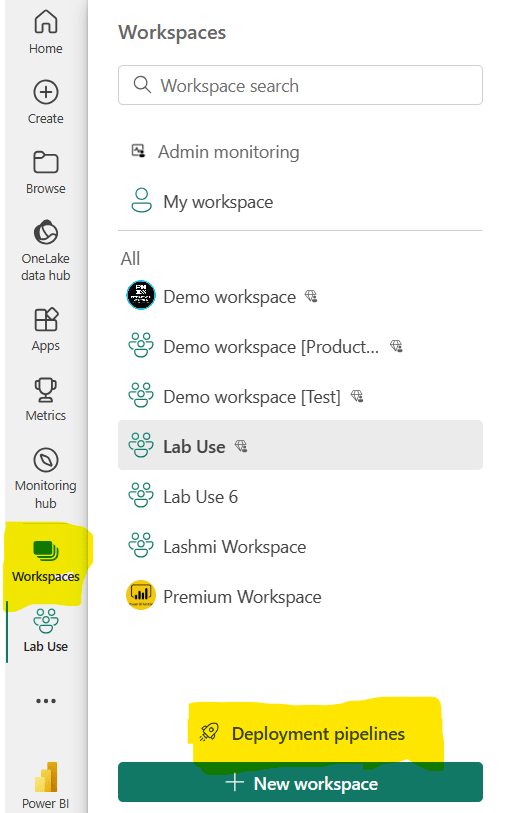
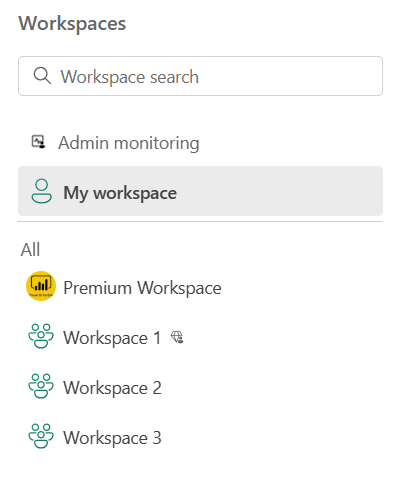
15. So when you click on workspace, you get the below options.
- Admin monitoring
- My workspace
- List of all the workspaces in your profile
- Deployment pipelines
- Option create new workspace
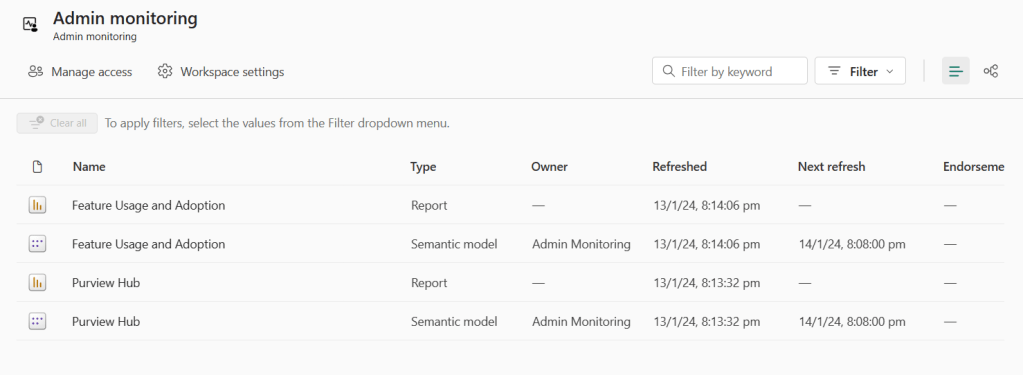
16. Admin monitoring -This is designed to provide admins with monitoring capabilities. Using this workspace, admins can perform security and governance settings. The admin monitoring workspace is automatically installed during the first time any Microsoft Fabric admin accesses it.
17. Workspace settings window. These options are common for any workspace including the admin monitoring workspace.
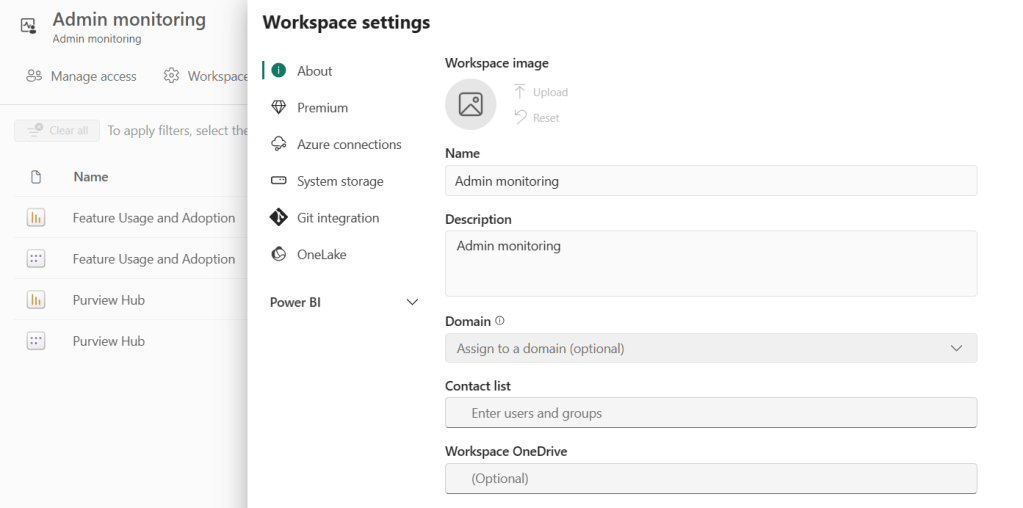
18. In the About option, you can upload the workspace image, Workspace name, Description, Domain, Contact list, and workspace one drive.
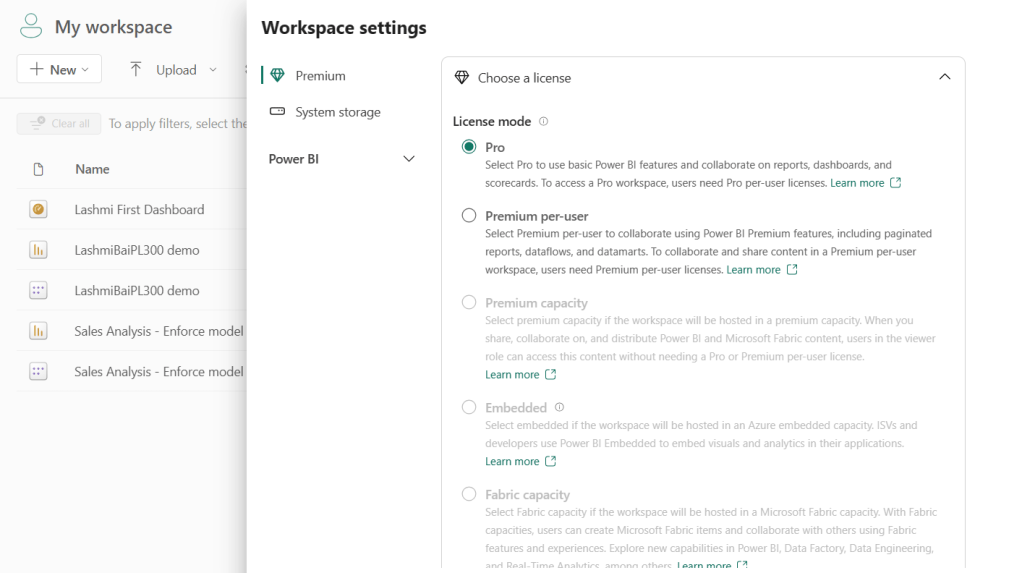
19. In the premium option, can select the license options. You can upgrade from pro to premium and not directly.
20. Select Premium per-user to collaborate using Power BI Premium features, including paginated reports, dataflows, and data marts.
21. Select Pro to use basic Power BI features and collaborate on reports, dashboards, and scorecards. To access a Pro workspace, users need Pro per-user licenses
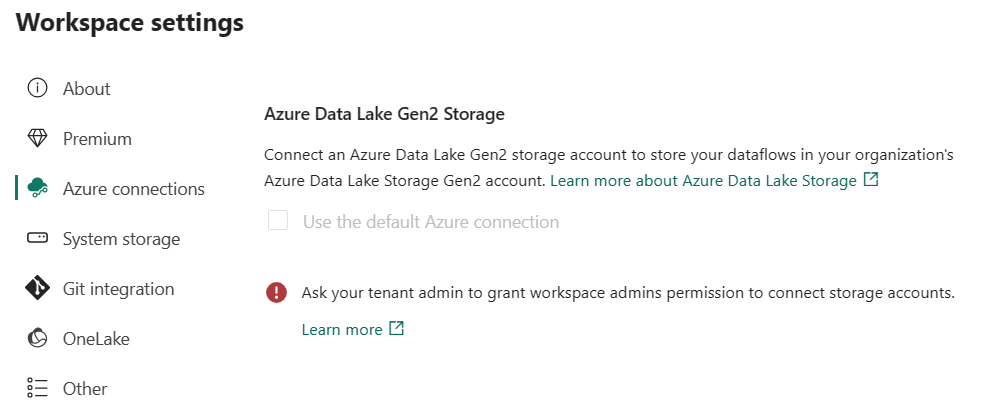
22. Under Azure, you can get the settings to connect to Azure Data lake storage Gen2. Connect an Azure Data Lake Gen2 storage account to store your dataflows in your organization’s Azure Data Lake Storage Gen2 account.
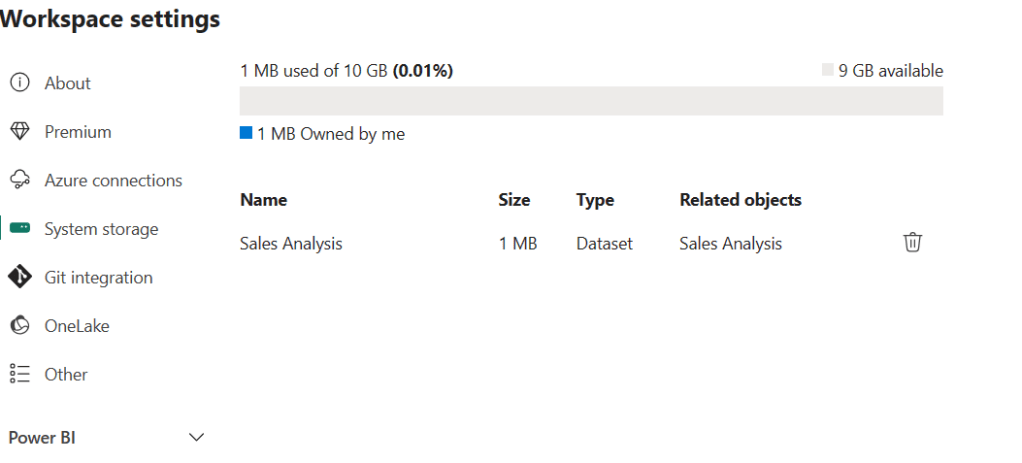
23. In the Pro license, you get 10 GB of space.
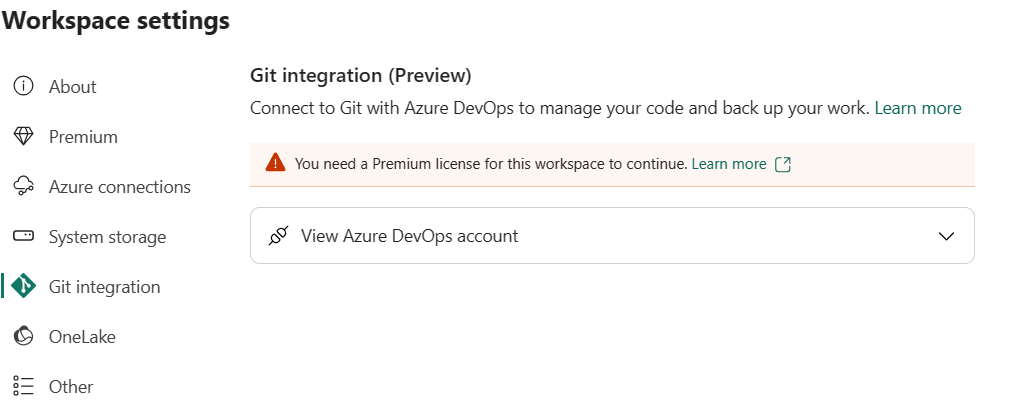
24 Github integration – Connect to Git with Azure DevOps to manage your code and back up your work.
25. Under Other, you have the option to delete the workspace.
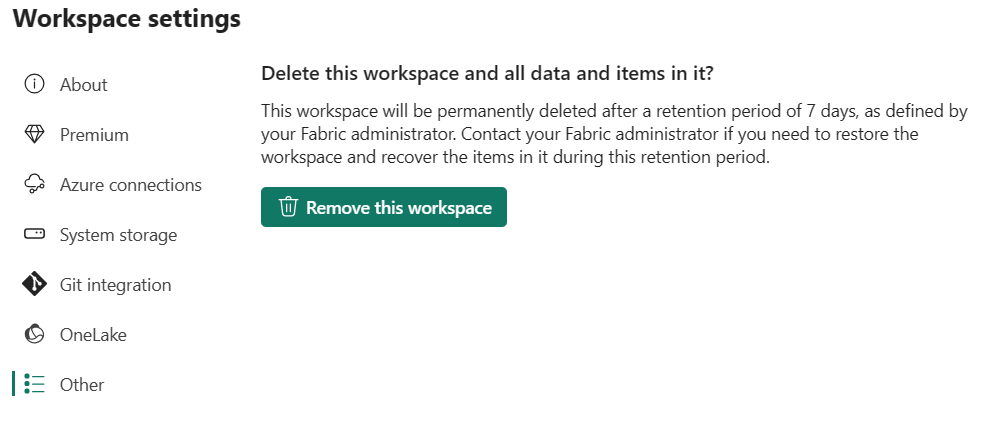
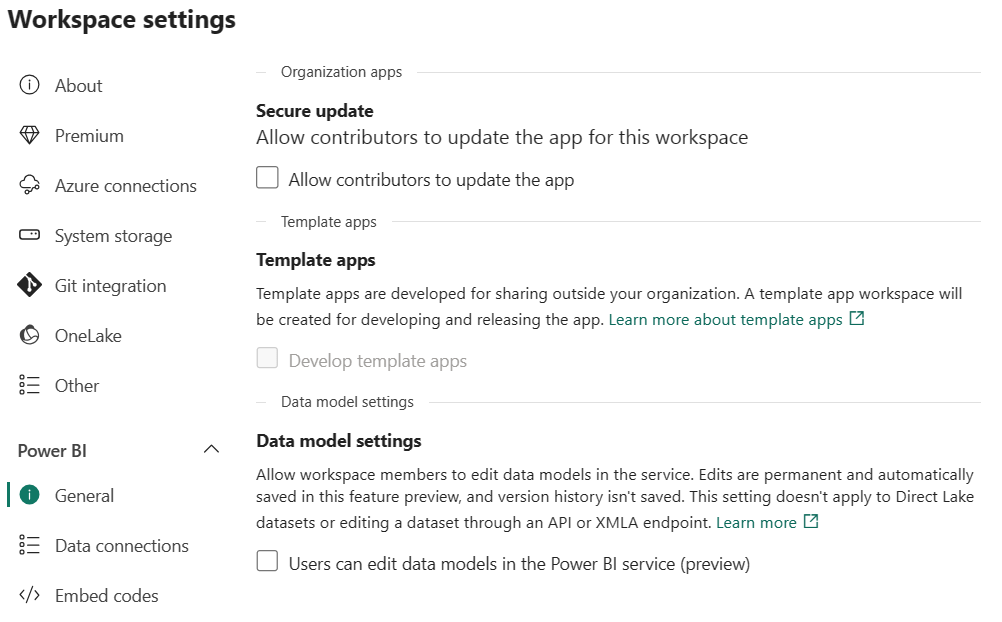
26. Only when the admin of the workspace provides access contributors can update the app.
27. template apps are created to share outside the organization. A template app workspace will be created to develop and release the app.
28. The options you see under settings under “My workspace” is as below.
29. Now, let’s see the difference between the Pro workspace and Preimun workspace windows.
Pro workspace below – If the app is not created, the create app option. If the app is created, you get the update app option.
To create an app, you need a pro license.
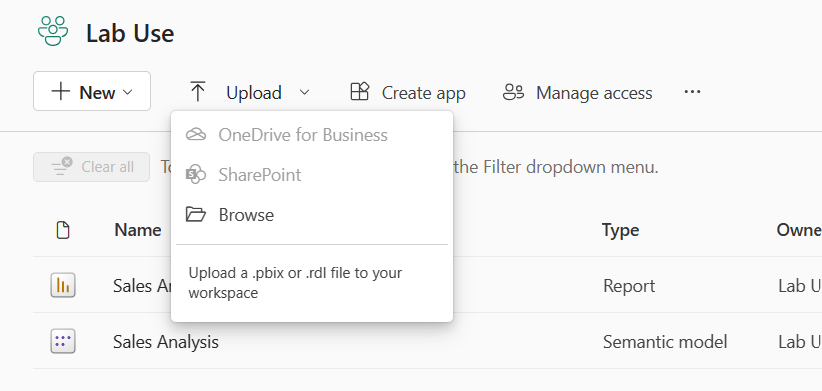
30. Since Power BI is a Microsoft product, if your data is in Sharepoint or Onedrive, you have the option to directly connect as shown below.
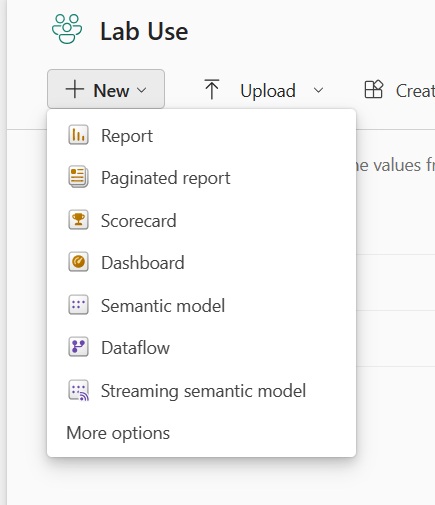
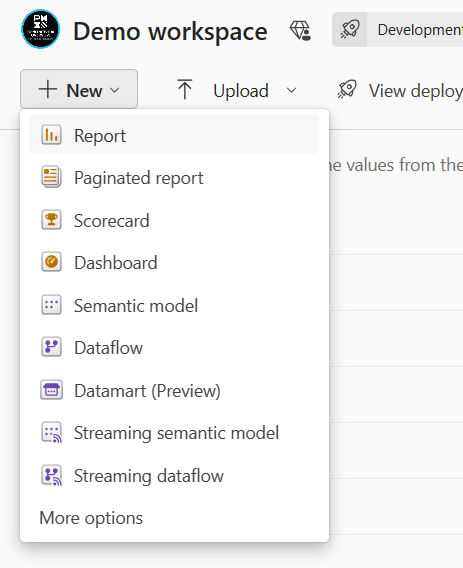
31. Options to create new type in Pro vs Premium.
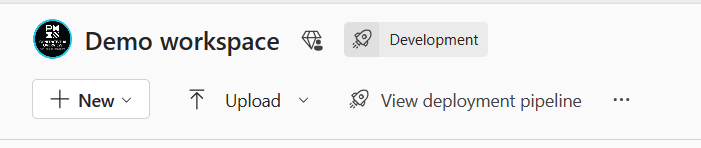
32. If a development pipeline is created, then you have a label as below.
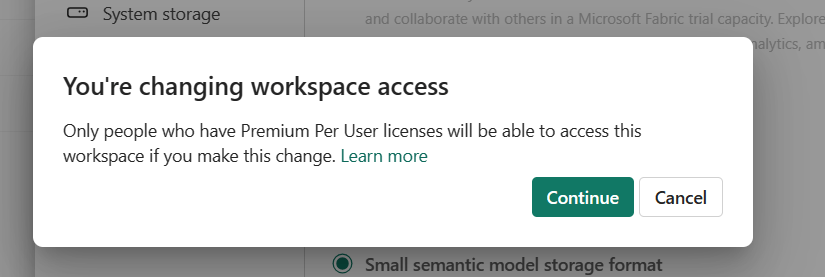
33. If you change a workspace from PRO to PREMIUM, then you see the below pop-up message.
34. The development pipeline option is only for Premium users and not for PRO workspace.
35. Workspace roles are very important to remember.
| Capability | Admin | Member | Contributor | Viewer |
|---|---|---|---|---|
| Update and delete the workspace. | ||||
| Add or remove any user in a workspace role. | ||||
| Allow Contributors to update the app for the workspace. | ||||
| Add members or others with lower permissions. | ||||
| Publish, unpublish, and change permissions for an app. | ||||
| Update an app. | If allowed 1 | |||
| Share items in apps, including semantic models.2 | ||||
| Allow others to reshare items.2 | ||||
| Feature apps on colleagues’ home. 7 | ||||
| Manage semantic model permissions.3 | ||||
| Feature dashboards and reports on colleagues’ home.6 | ||||
| Publish, Create, edit, and delete content, such as reports, in the workspace. | ||||
| Create a report in another workspace based on a semantic model in this workspace.3 | ||||
| Copy a report.3 | ||||
| Create metrics that’s based on a semantic model in the workspace.3 | ||||
| Schedule data refreshes via the on-premises gateway.4 | ||||
| Modify gateway connection settings.4 | ||||
| View and interact with an item.5 | ||||
| Read data that’s stored in workspace dataflows. | ||||
| Create subscriptions to reports 6 | ||||
| Subscribe others to reports 6 | ||||
| Manage subscriptions created by others. | ||||
| Can receive subscriptions created by others 6 |
36. When you click on create tab, you get the below option.
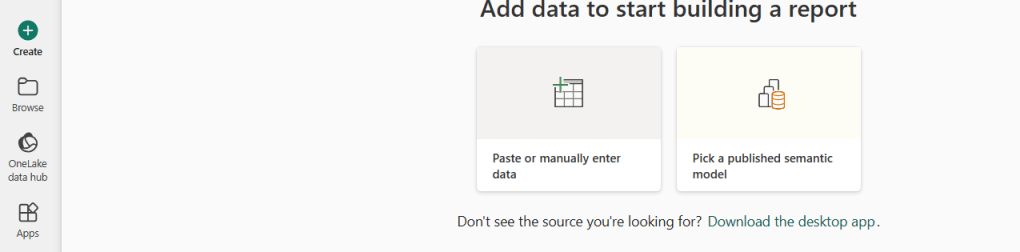
37. When you click on the published semantic model, then you get the below options.
38. When you click on browse, you get the below screen – Recent, Favourite and Shared with me.
39. When you click on Metrics, you get the below screen – Metrics is a data-driven and collaborative way to track key business metrics.
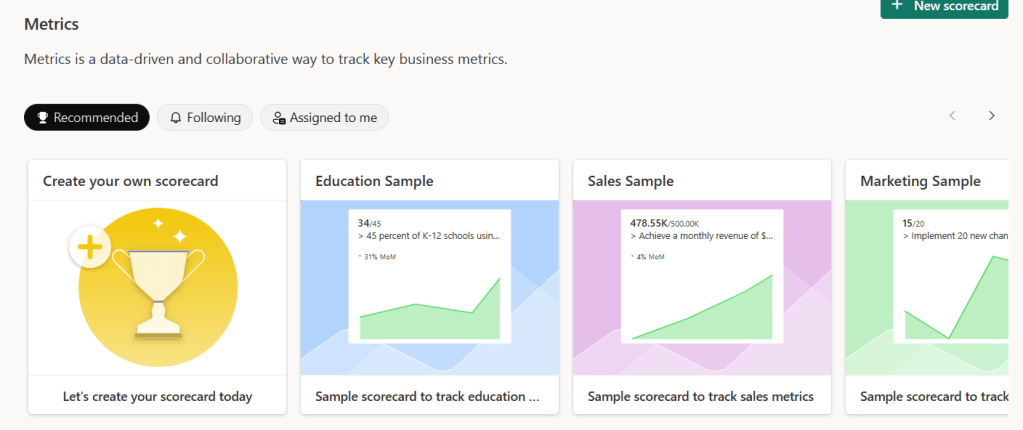
40. A few sample scorecards are below.
41. One has the option to connect to Power Automate when using Metrics.
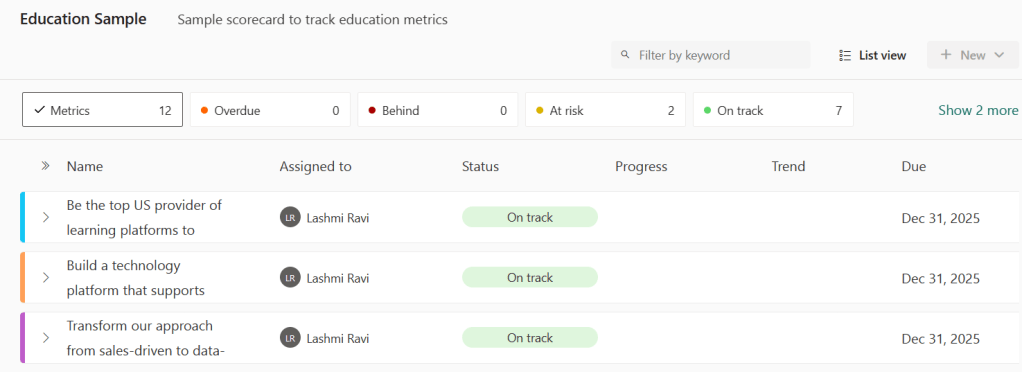
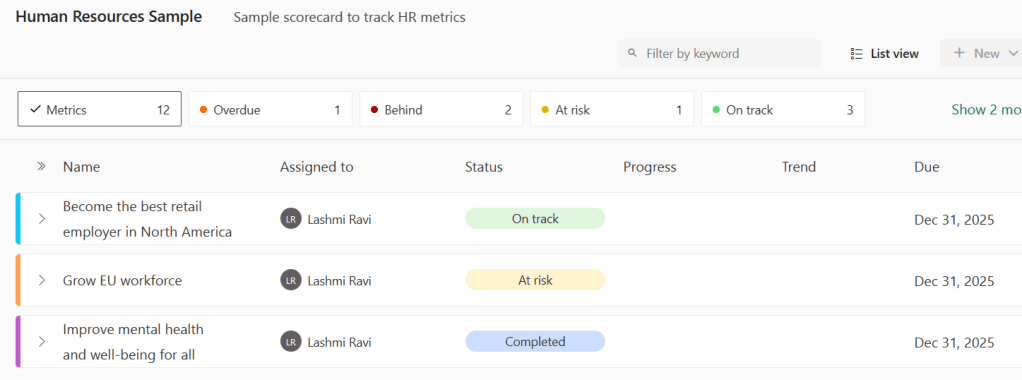
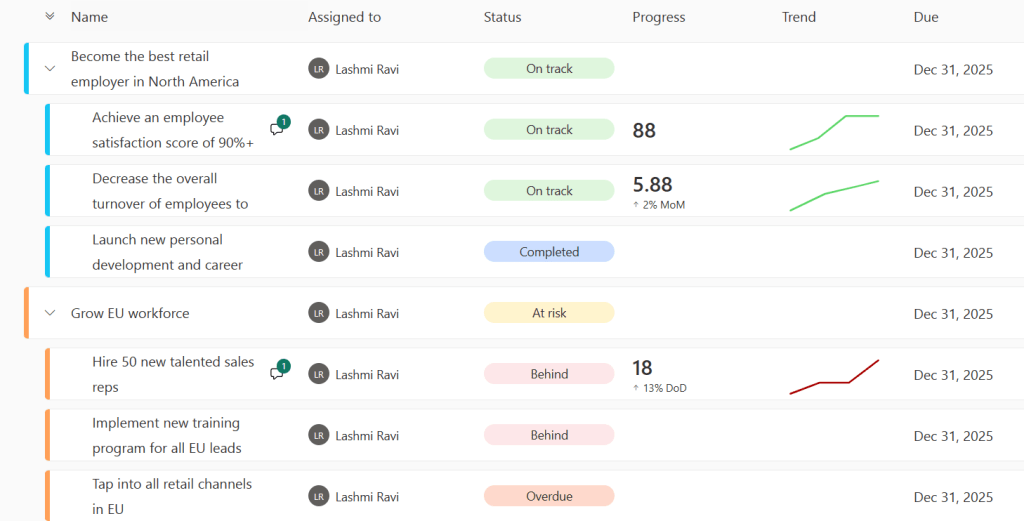
42. Tracking of metrics as below
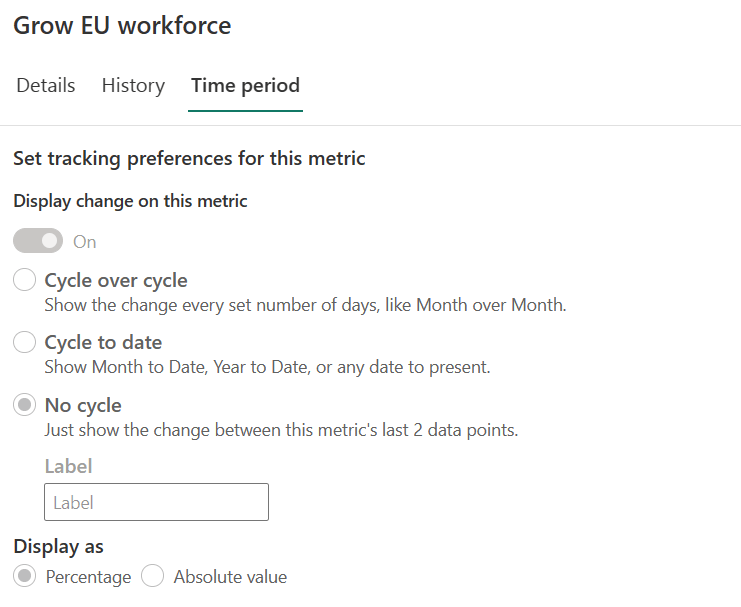
43. One also has the option to create metrics and submetrics as shown below with progress and trend options to display.
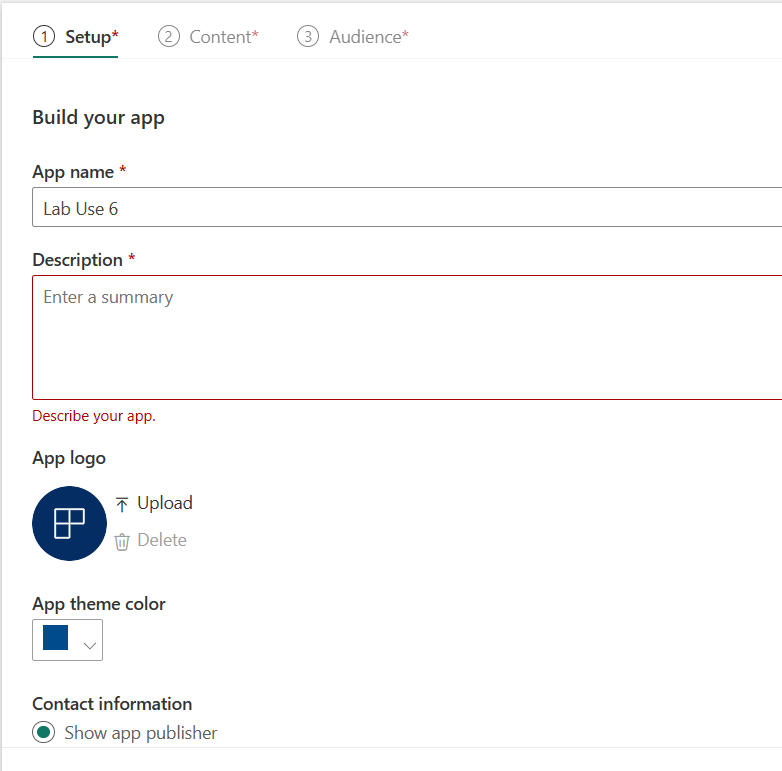
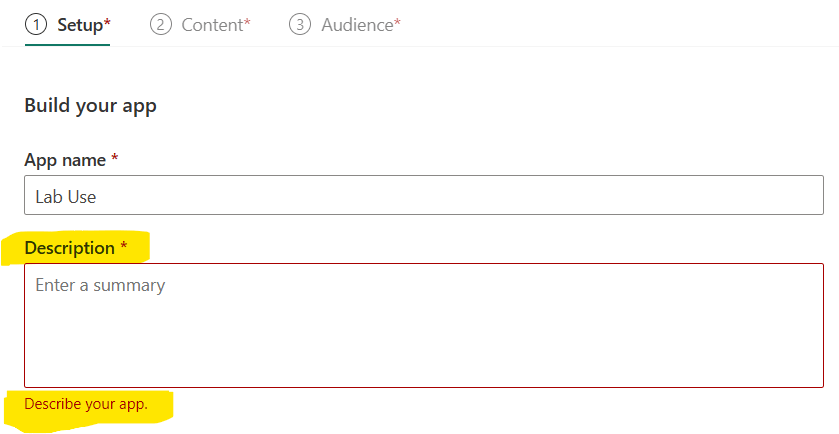
44. When you have a Pro license you can create an APP. There are three tabs one can see while creating an APP. Setup, Content, Audience.

When you create an app, you need to provide the below details like
- App name – Mandatory
- App description – Mandatory
- App logo
- App theme color
- Contact information – App publisher, workspace contacts, or specific users or groups.
- Advanced settings
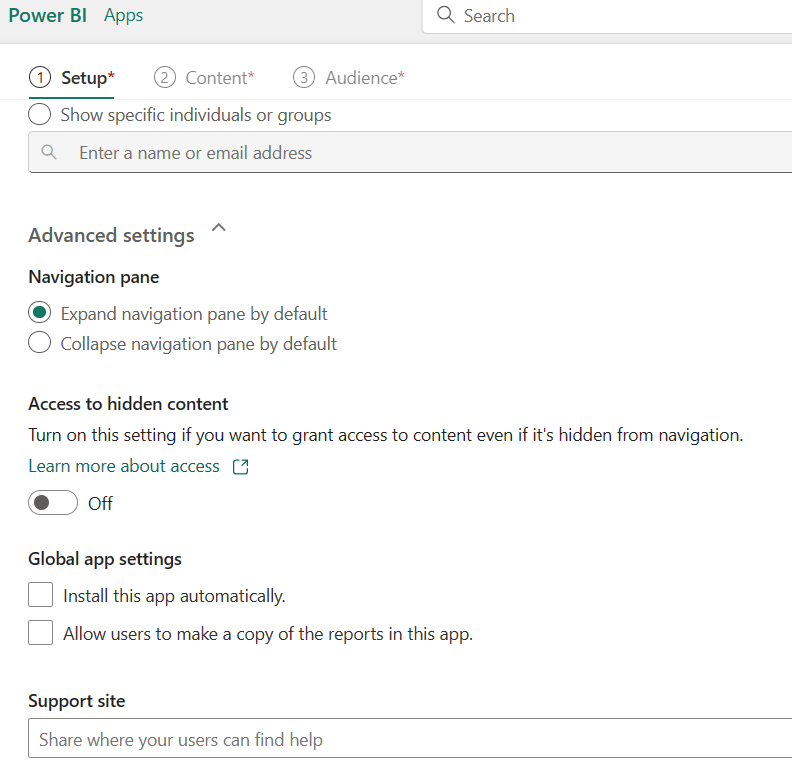
45. Advanced settings in the app are the below options.
- Navigation Pane
- Access to hidden content
- Global app settings
- support Site
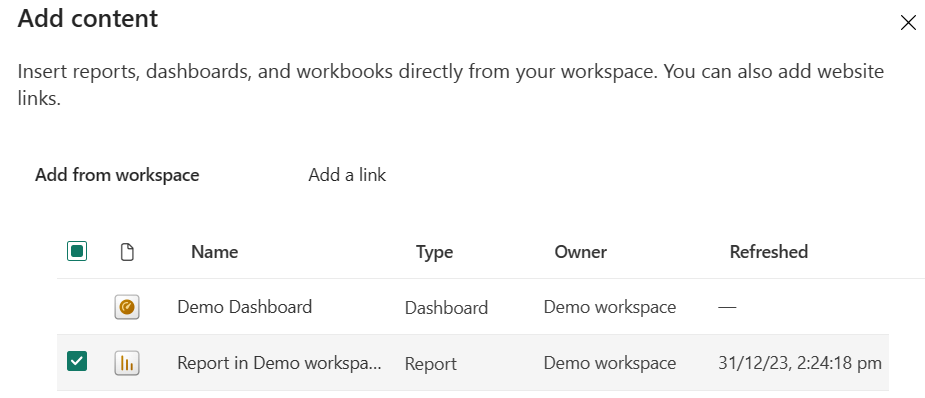
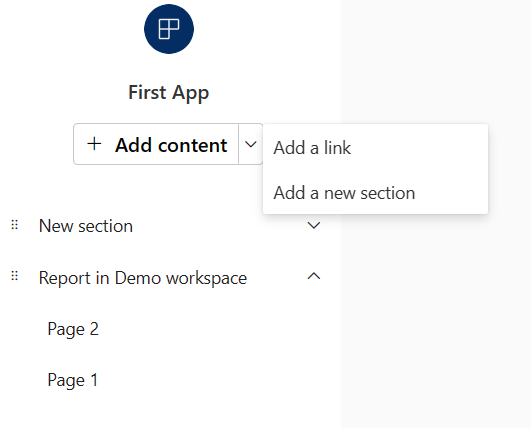
46. When one clicks on the Content button, you can add content from the workspace. Also has the option to add 1) a Link 2) an Add section option as a dropdown.
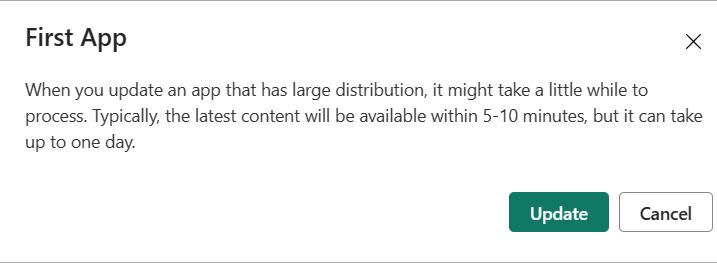
47. When one updates the app, a pop-up message as below.
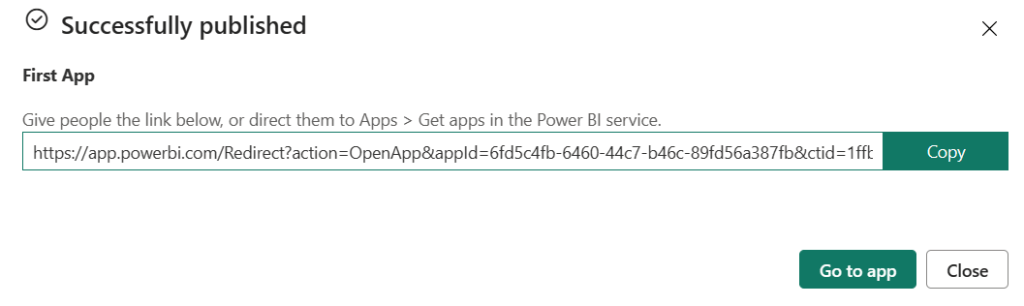
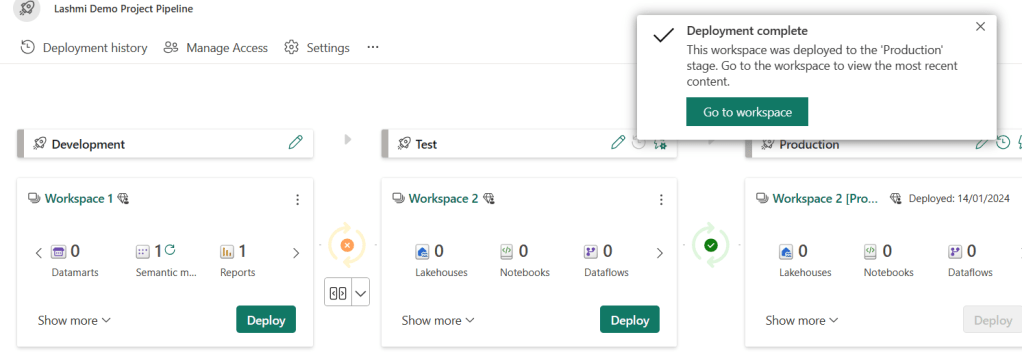
48. After publishing, you get the below successful message.
49. When you go to App,
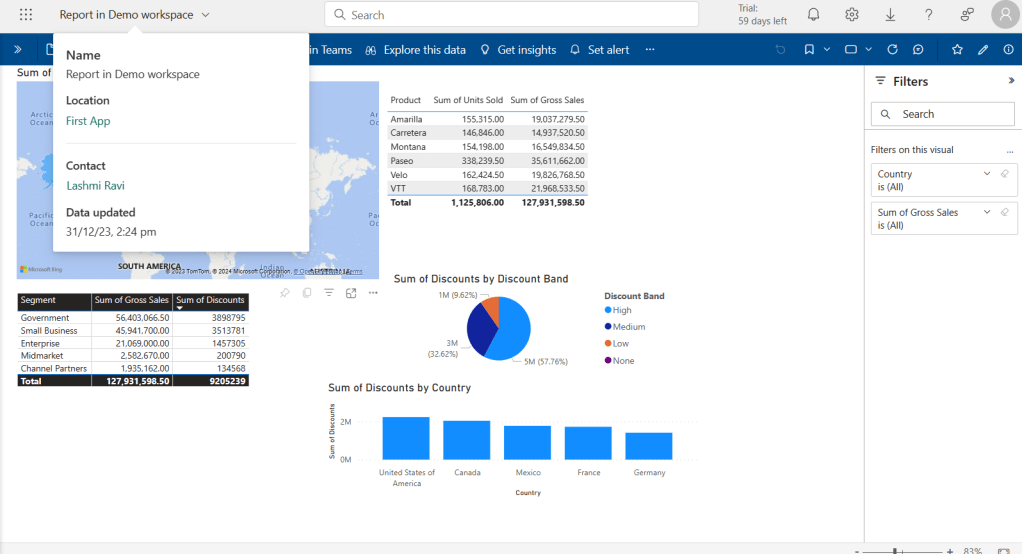
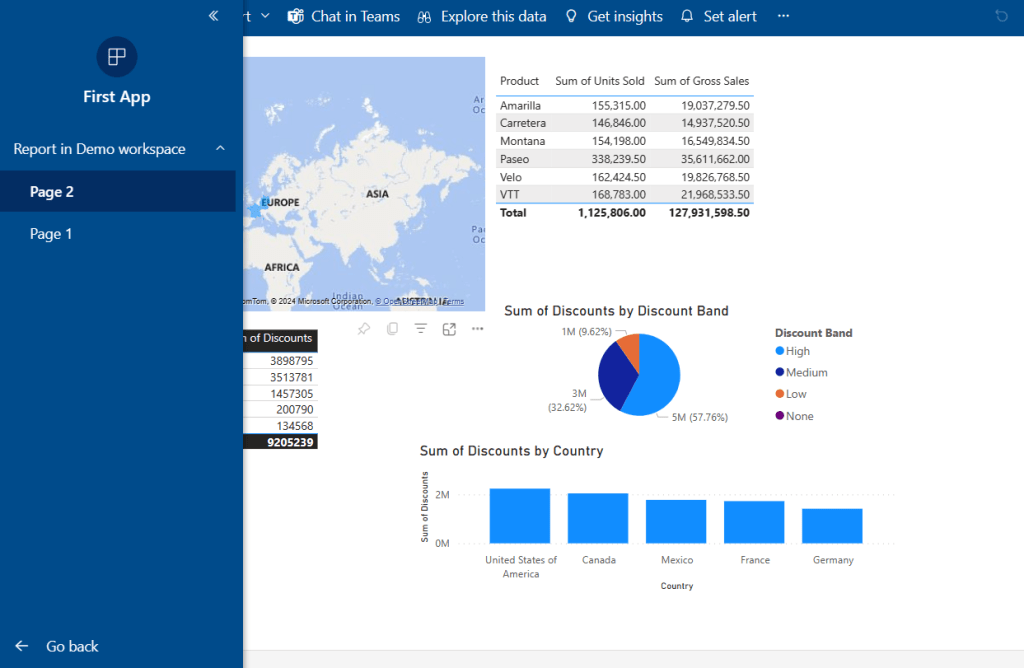
50. The App, looks like Report but with menu pages.
51. After you publish the app, you can do the following.
- Update the app
- App Audience
- App settings
- Feature this App on the homepage
- Unpublish the App
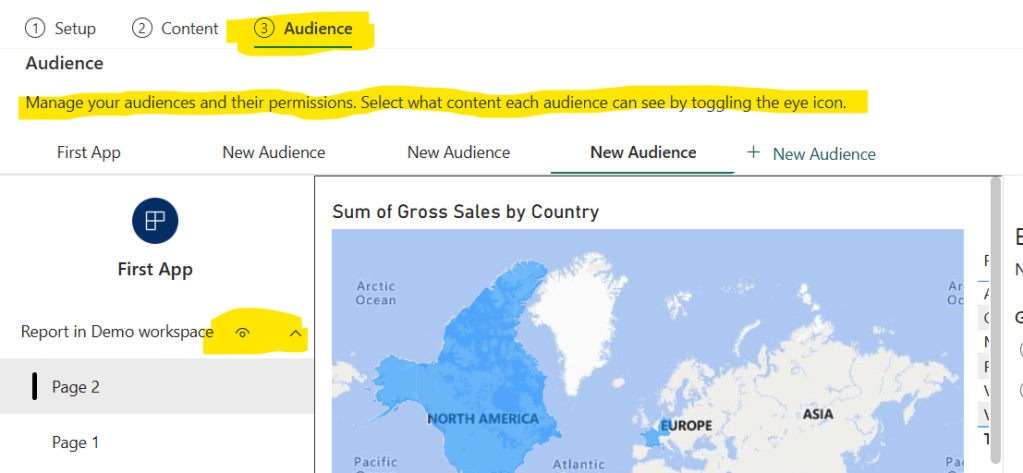
52. You can also create different versions for different audiences as shown below. Create new audience – > Select the content they should see using eye visible icon.
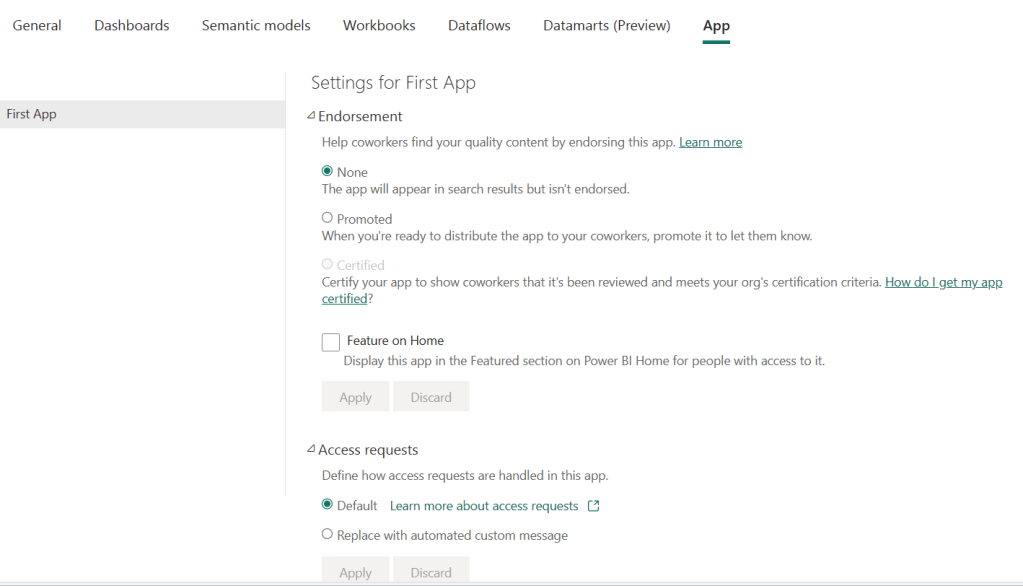
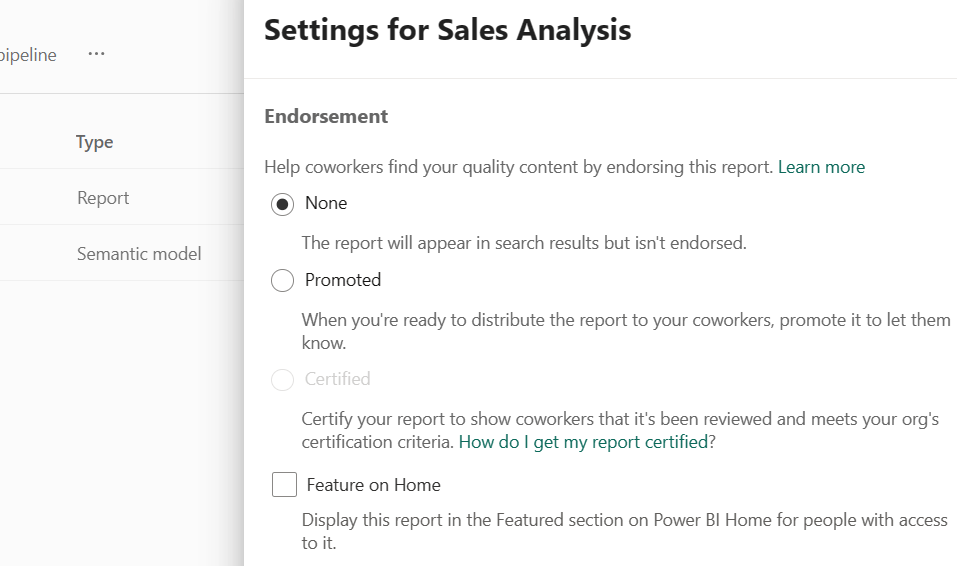
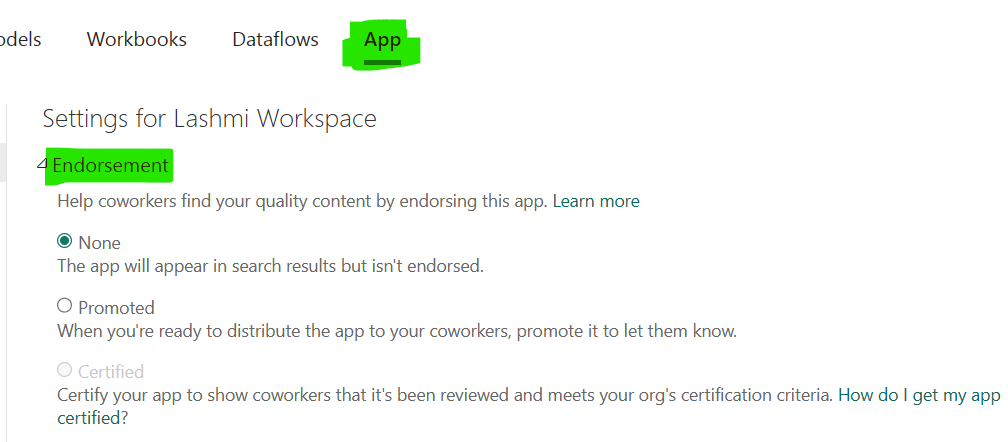
53. APP Settings page as below.
- Just like an endorsement of the dataset, you can also endorse the app 1) None 2) Promoted 3) Certified
- Feature on Home Page
- Access request – How to handle app access requests. One can use the replace custom message option- Users requesting access to the app or its content will get a custom message. Explain why they don’t have access or how they can get it.
54. Apps are collections of dashboards and reports in one easy-to-find place.
55. App Top Menu Bar Options – Very similar to Reports

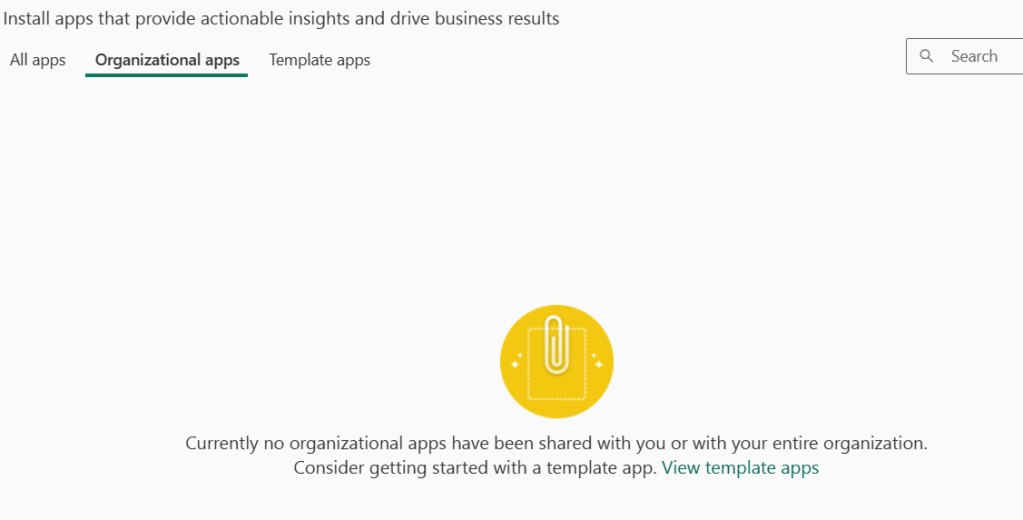
56. To navigate to the Power BI Apps, Apps Button – > Get apps
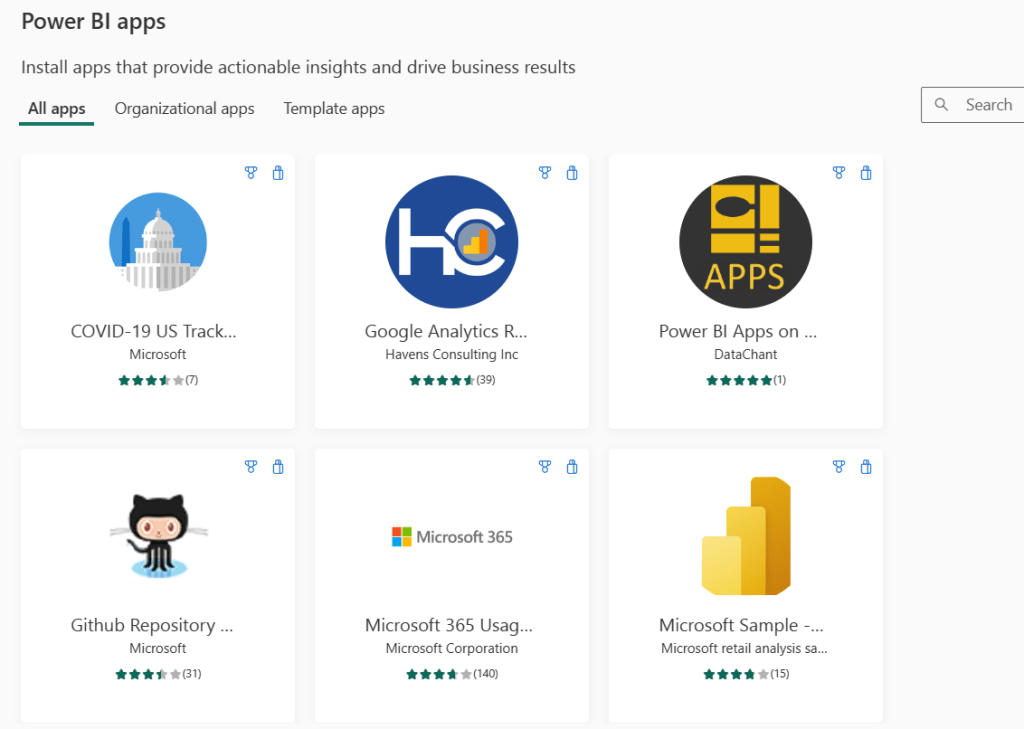
57. Organisation Apps vs Template Apps – Create a template app that you can distribute to external Power BI users, via Microsoft AppSource.
58. Apps are easy to find and install in the Power BI service (https://app.powerbi.com). You can send your business users a direct link to the app, or they can search for it in AppSource. If your Power BI administrator gives you permissions, you can install an app automatically in your coworkers’ Power BI accounts
59. After they install the app, they can view it in their browser or mobile device.
For your users to view your app, they need a Power BI Pro license, too, or the app needs to be stored in a Power BI Premium capacity.
60. Power BI template apps allow Power BI Pro or Power BI Premium users to gain immediate insights through prepackaged dashboards and reports that can be connected to live data sources.
61. Process to publish the App below
| Stage | Power BI Desktop | Power BI service | Partner Center |
|---|---|---|---|
| One | Build a data model and report in a .pbix file | Create a workspace. Import .pbix file. Create a complementary dashboard | Register as a partner |
| Two | Create a test package and run internal validation | ||
| Three | Promote the test package to preproduction for validation outside your Power BI tenant, and submit it to AppSource | With your preproduction package, create a Power BI template app offer and start the validation process | |
| Four | Promote the preproduction package to production | Go live |
62. Template apps submissions are managed in Partner Center. Use the same Microsoft Developer Center registration account to sign in. You should have only one Microsoft account for your AppSource offerings. Accounts shouldn’t be specific to individual services or offers.
63. Tips
- Make sure your app includes sample data to get everyone started in a click.
- Limit semantic model size (rule of thumb: .pbix file < 10MBs). This typically means keeping the size of sample data as small as possible.
- Carefully examine your application by installing it in your tenant and in a secondary tenant. Make sure customers only see what you want them to see.
- Use AppSource as your online store to host your application. This way everyone using Power BI can find your app.
- Consider offering more than one template app for separate unique scenarios.
- Enable data customization. For example, support custom connection and parameters configuration by the installer.
- If you’re an independent software vendor and are distributing your app through your web service, consider automating parameter configuration during installation to make things easier for your customers and to increase the likelihood of a successful installation.
64. To install, customize, and distribute a template app, you need:
- A Power BI pro license.
- Permission to install template apps on your tenant.
- A valid installation link for the app, which you get either from AppSource or from the app creator.
- A good familiarity with the basic concepts of Power BI.
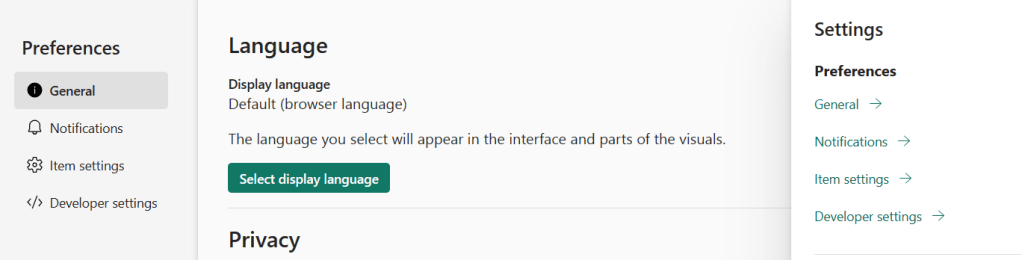
65. Power BI Service General settings – When you click on gear icon on the top, you can see the below options.
- General – Language, Privacy and Close account
- Notifications – Subscriptions, Alerts, Email and Teams notification settings.
- Item settings – ArcGIS maps settings – ArcGIS for Power BI is a mapping visualization that helps you to enrich your data, reports, and dashboards
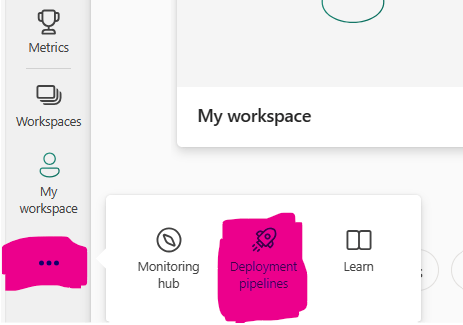
66. Now, let’s get into the deployment pipeline. This feature is available in Premium workspace only. There are two way to create a pipeline.
- Click workspace -> at the bottom you can find “Create deployment pipeline”.
2. The second option is from the premium workspace as shown below.
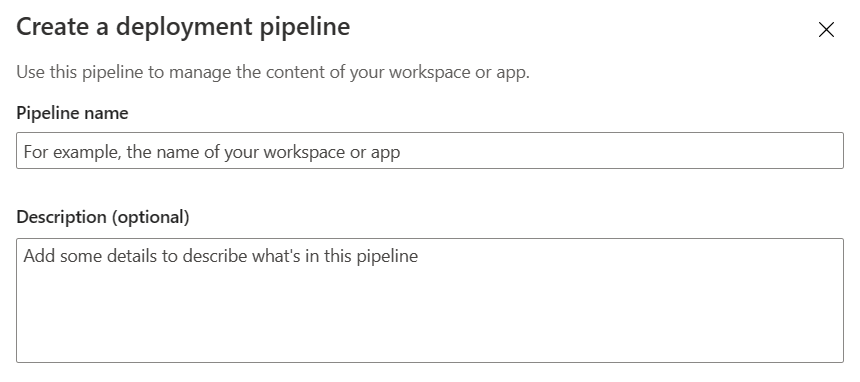
67. Okay, now one has to note that a description of the App is mandatory however for a pipeline it is optional.
68. Then create the stages
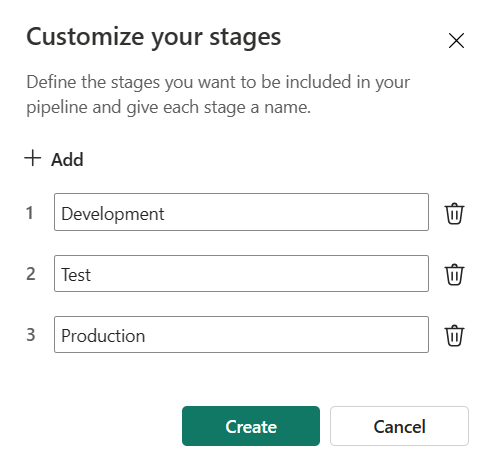
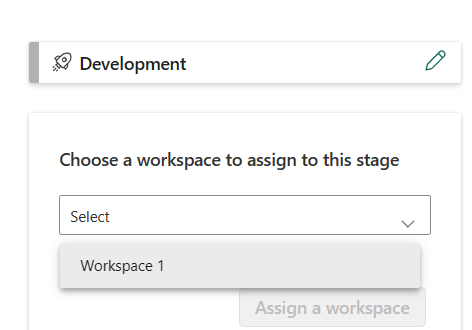
69. Either you can assign the workspace which you created the pipeline to any of the stages now or later.
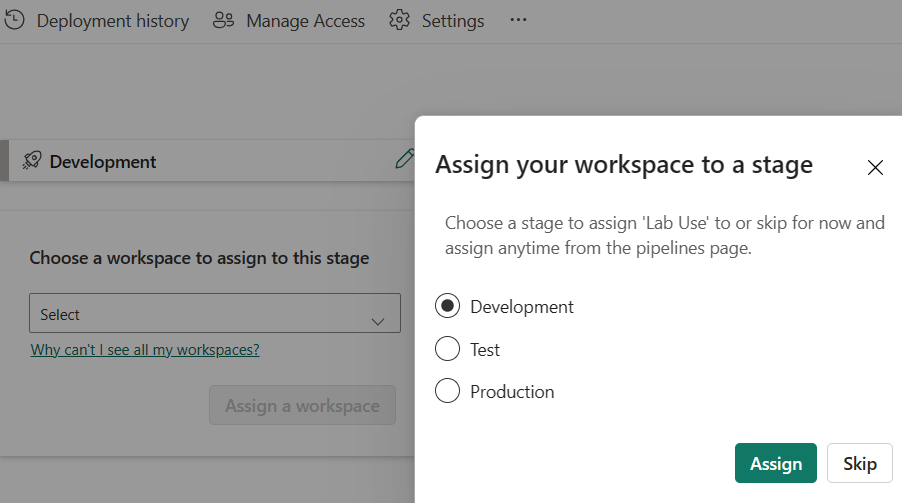
70. I can’t see all the workspace just the one within which I created the pipeline.
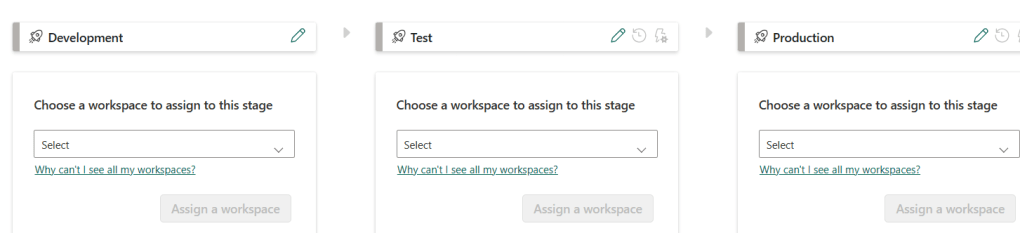
71. Choose a workspace – Important points to remember are as below.
- You must be an admin of the workspace.
- The workspace isn’t assigned to any other pipeline.
- The workspace must reside on a Fabric capacity.
- To assign a workspace, you need at least workspace member permissions for the workspaces in its adjacent stages.
72. You can view all the pipelines created in the screen below.
73. I can see only the preimum workspace which i can assign.
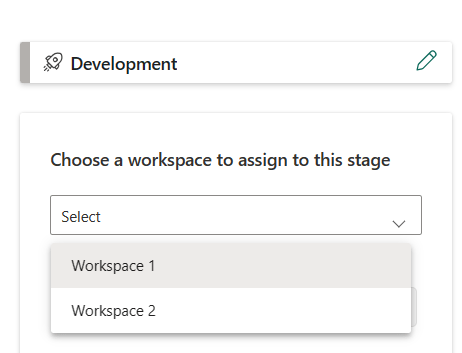
74. Workspace 1 is the only premium workspace I have got now. Now, let me make one more workspace as Premium.
75. Now i can see both the workspace which i can assign.
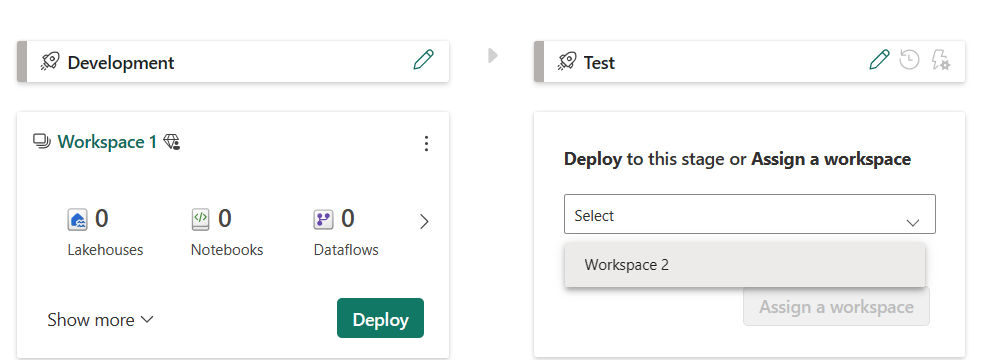
76. Once I assign one of the workspaces to development, that workspace is not available to assign to another workspace.
75. As soon as I deployed test workspace to production, a new production workspace is created.
76. It is important to note that you cannot workspace when it is assigned to one of the pipeline.
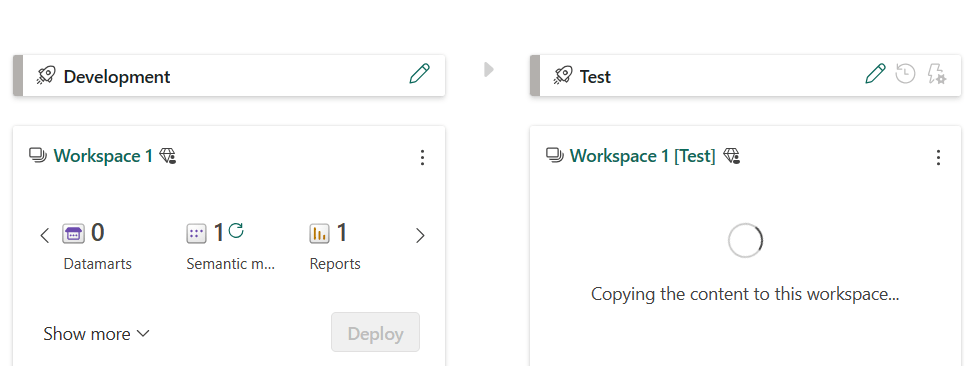
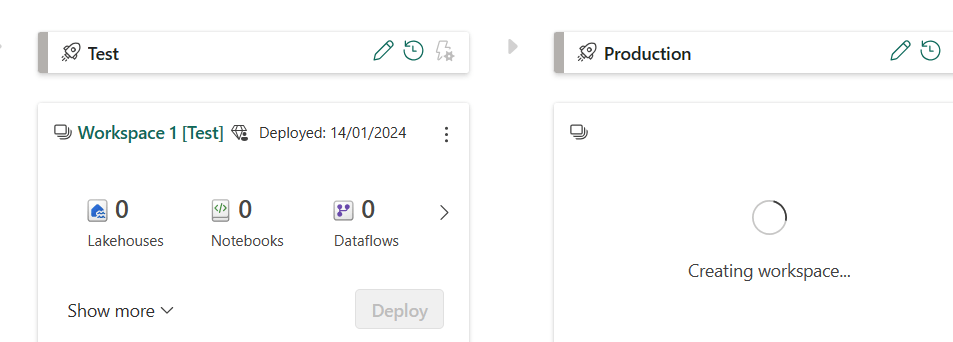
77. Now, instead of assigning different workspace, let me assign one workspace to developement. Once i deploy, automatically, test and production workspace are created as detailed in steps below.
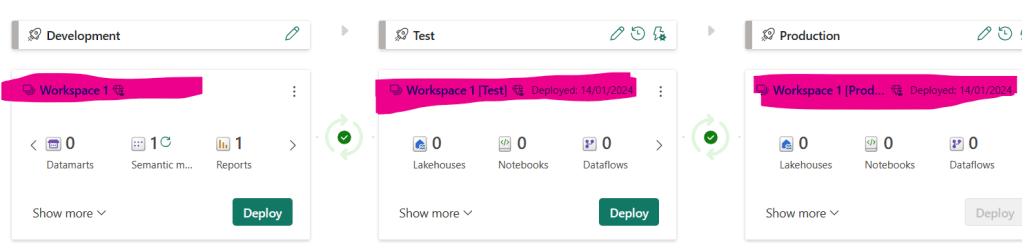
78. Now i have separate workspace as shown below.
79. Two important topics in Power BI service are Lineage view and Usage Metrics. Let’s see about the lineage view.
80. Lineage view – In modern business intelligence projects, understanding the flow of data from the data source to its destination can be a challenge. The challenge is even bigger if you’ve built advanced analytical projects spanning multiple data sources, artifacts, and dependencies
81. Questions like “What happens if I change this data?” or “Why isn’t this report up to date?” can be hard to answer. They may require a team of experts or deep investigation to understand. To answer these and other questions Microsoft created the lineage view.
82. Advantages of using Lineage view:
- Lineage view has helped us maintain multiple workspaces whilst ensuring that we can clearly see how one change in one dataset can impact multiple reports and dashboards.
- We can easily identify reports that haven’t been refreshed and kick off refreshes from a friendly interface and also remove unused datasets easily.
- As a central team managing power BI reports, this has proven to save us a lot of time”
- Sometimes troubleshooting can be very challenging, as data may potentially move between workspaces, and understanding the source of the data and finding the root cause of an issue is not an easy thing to do.
- It shows connections between all workspace artifacts, including connections to dataflows, both upstream and downstream.
83. Lineage view shows all the data types in Power BI.
- Dataflows
- Reports
- Dashboards
- Semantic Models
- Paginated reports
- App
- Scorecards
- Datamarts
84. Every workspace automatically has a lineage view. You need at least a Contributor role in the workspace to view it
85. It shows key information like
- Last refreshed
- Promoted or certified dataset
- Gateways
85. When you have multiple reports, clicking on the report shows the path upstream and downstream.
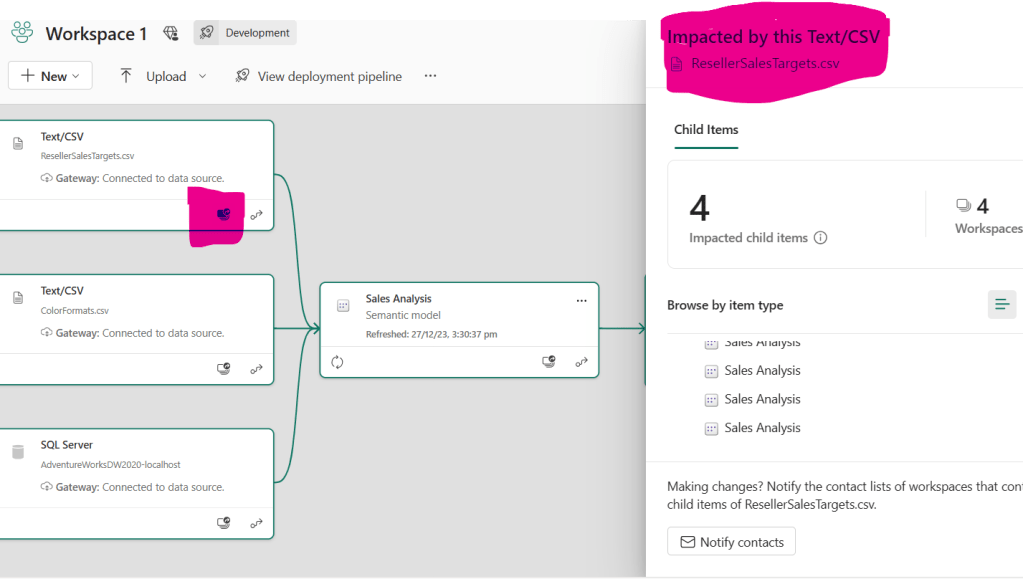
86. When you click on a particular dataset icon as shown below, you will get the metadata of the dataset in the lineage flow.
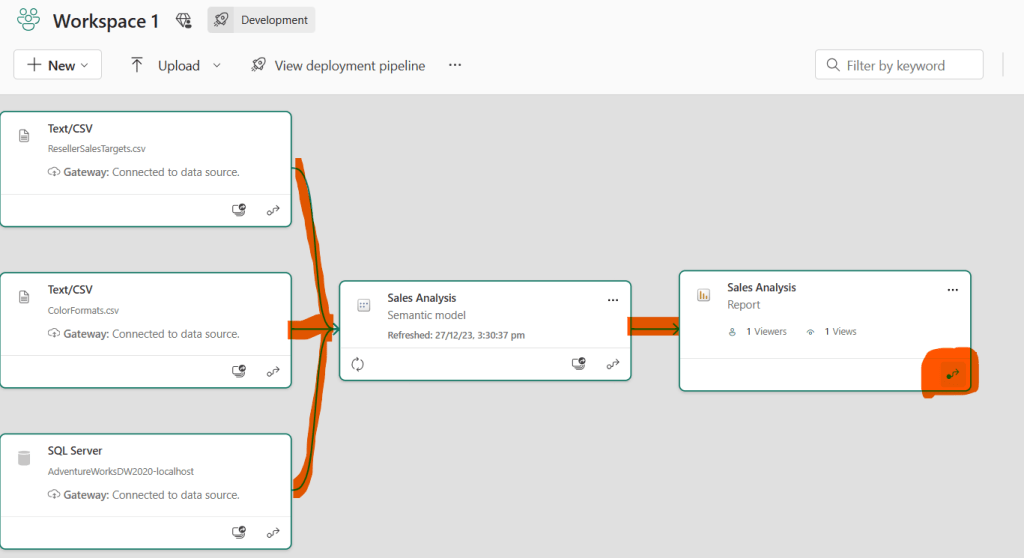
87. When you click on lineage view, it will highlight the flow from the first to the last as shown below.
88. Permissions Limitations :
- You need a Power BI Pro license to see lineage view.
- Lineage view is available only to users with access to the workspace.
- Users must have an Admin, Member, or Contributor role in the workspace. Users with a Viewer role can’t switch to lineage view.
89. Certified datasets – anyone in the org can certify.
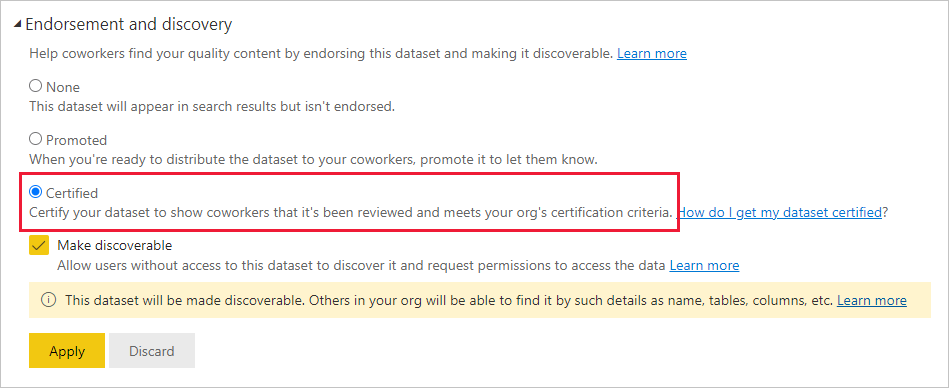
When you certify, make sure mark it as “Discoverable”. Others will be able to find it by Name, details, description etc.
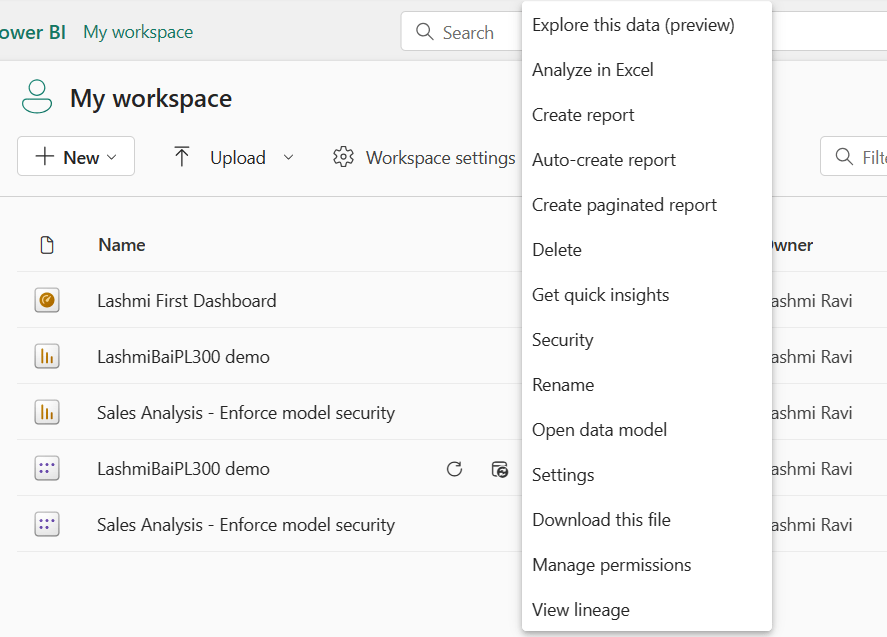
90. When you right-click on the dataset, the options you get are as below
- Explore this data
- Analyse in Excel
- Create report
- Auto create report – This is a new option in PowerBI
- create paginated report
- Delete
- Get quick insights – auto create visuals which you can pin to report / dashboard
- Security – This is moved to Power BI Desktop – RLS roles to be created.
- Rename
- Open data model
- Settings
- Download this file
- Manage permissions
- View lineage
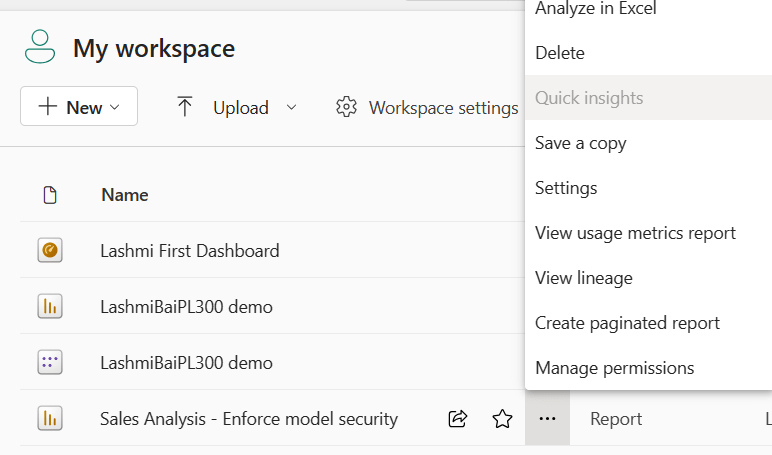
91. Below are the options available for the Report.
- Analyse in Excel
- Delete
- Save a copy
- Settings
- View usage metrics report
- View lineage
- Create paginated report
- Manage permissions
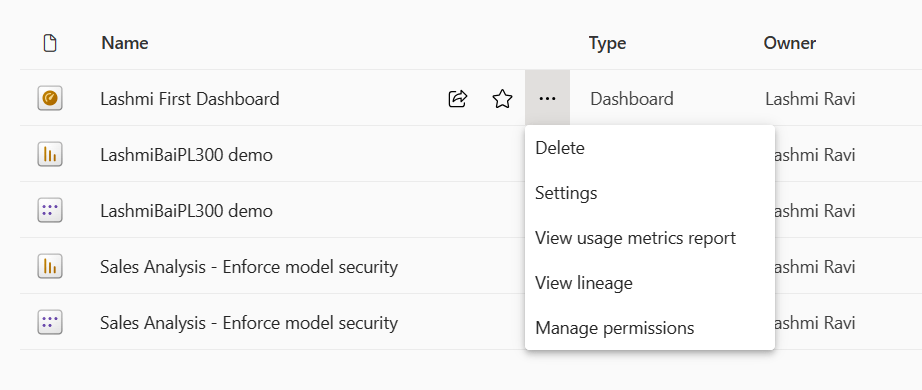
92. Below are the options available for the dashboard
- Delete
- Settings
- View usage metrics report
- View lineage
- Manage permissions
93. How to Endorse various data types in Power BI
- Data sets – Under settings
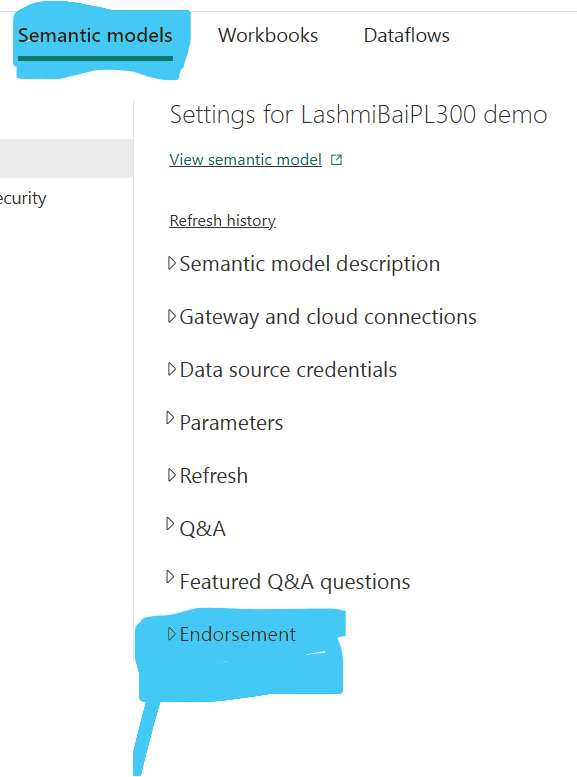
2. Reports – Settings
2. There is no endorsement for dashboard
3. App – > Workspace – More options – > App settings – > Endorese the app
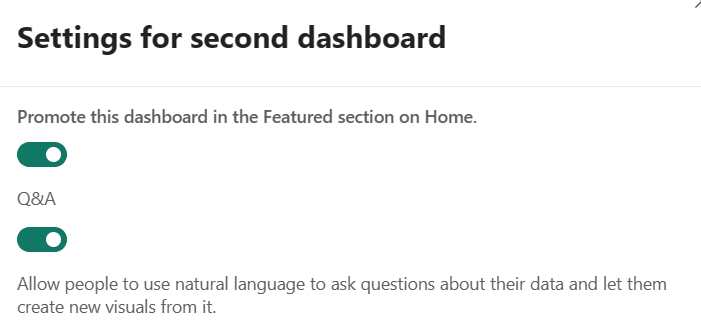
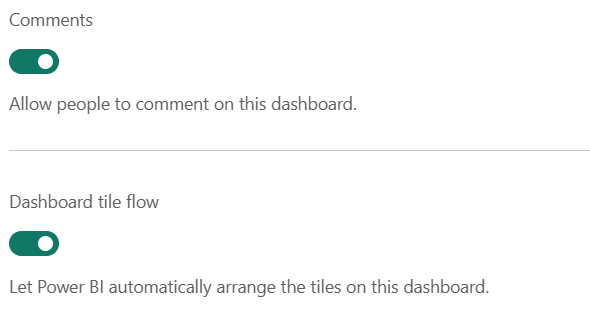
94. Lets look at the Dashboard specific settings
- Promote the dashboard in the featured section in Home page
- Q&A – Allow people to use natural language to ask questions about their data and let them create new visuals from it.
- Add comments to the Dashboard- Dashboard tile flow
- Dashboard flow tile – Let Power BI automatically arrange the tiles on this dashboard.
95. Analyse in Excel – Creates an Excel file with a dataset so you can use Excel features to create a dashboard
96. IMPORTANT - Quick Insights option is enabled only for Datasets and Reports and not for Dashboard.
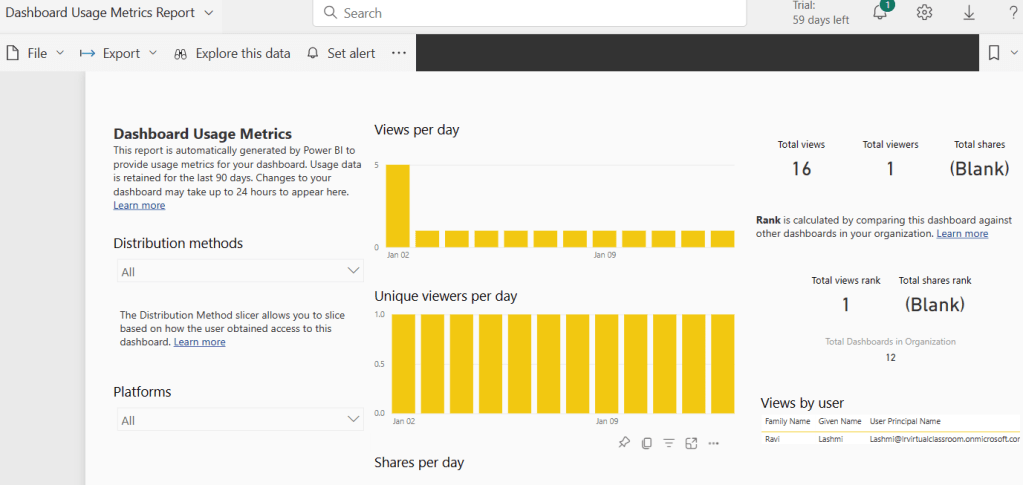
97. View usage metrics report – Usage metrics reports are read-only. However, you can copy a usage metrics report.
Copying creates a standard Power BI report that you can edit. You can also build your own reports in Power BI Desktop based on the underlying semantic model, which contains usage metrics for all dashboards or all reports in a workspace.
To begin with, the copied report shows metrics just for the selected dashboard or report. You can remove the default filter and have access to the underlying semantic model, with all the usage metrics of the selected workspace
98. PERMISSIONS FOR USAGE METRICS –
- You need a Power BI Pro or Premium Per User (PPU) license to run and access the usage metrics data. However, the usage metrics feature captures usage information from all users, regardless of the license they’re assigned.
- To access usage metrics for a particular dashboard or report, you must have edit access to that dashboard or report.
99. IMPORTANT NOTE: If you pin a tile from a usage metrics report to a dashboard, you can’t add that dashboard to an app.
100. Dashboard usage metrics is same as report usuage metrics. only a few metrics are specific to the Dashboard.
- Shares per day – Number of times the dashboard was shared with another user or group.
- Total shares – Number of times the dashboard or report was shared in the past 90 days.
- Rank: Total shares – For total shares of all dashboards in the organization over the past 90 days, where does this dashboard or report rank.
- Report specific Usage metrics – Report page slicer –
101. Usage metrics reports don’t show up in Recent, Workspaces, Favorites, or other content lists. They can’t be added to an app.
102. See all workspace usage metrics – To see the metrics for all the dashboards or for all the reports in the workspace, you have to remove a filter. By default, the report is filtered to display metrics for only the dashboard or report that you used to create it.
103. I can’t run usage metrics on a dashboard or report – A: You can only see usage metrics for content you own or have permissions to edit.
104. Do usage metrics capture views from embedded dashboards and reports? – A: Usage metrics currently don’t support capturing usage for embedded dashboards, reports, and the publish to web flow. In those cases, we recommend using existing web analytics platforms to track usage for the hosting app or portal
105. There are four reports in the workspace but the usage metrics report only displays three. – A: The usage metrics report only includes reports (or dashboards) that have been accessed in the past 90 days. If a report (or dashboard) doesn’t show up, likely it hasn’t been used in more than 90 days.
Discover more from LR Virtual Classroom
Subscribe to get the latest posts sent to your email.
