Key pointers from the MS Learning path for PL-300
Power – BI Mobile Apps
1. Microsoft Power BI offers a set of mobile apps for iOS, Android, and Windows devices. These mobile apps let you connect to and interact with your cloud and on-premises data when you’re on the go, anytime, anywhere.
2. All the reports, dashboards, and apps you have available, either in the cloud in the Power BI service or on-premises on Power BI Report Server, are there.
3. The mobile apps provide most of the capabilities you have in the Power BI service for viewing, analyzing, and interacting with your data. The capabilities include cross-highlighting, cross-report drillthrough, and filtering
4. the mobile apps allow you to:
- View your data offline.
- Filter reports according to your geographic location.
- Scan barcodes on site to get directly to filtered data.
- Have your report start playing as a slideshow automatically whenever the app is launched (Windows app)
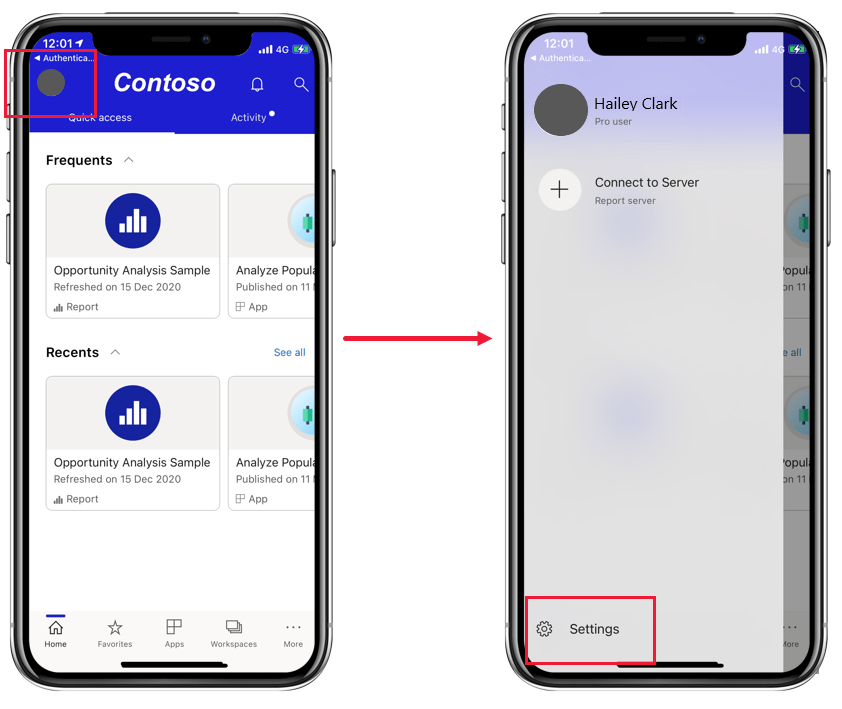
5. The header at the top of the home page, and the action bar at the bottom, contain items that help you get quickly to the content you need, or to perform various actions.
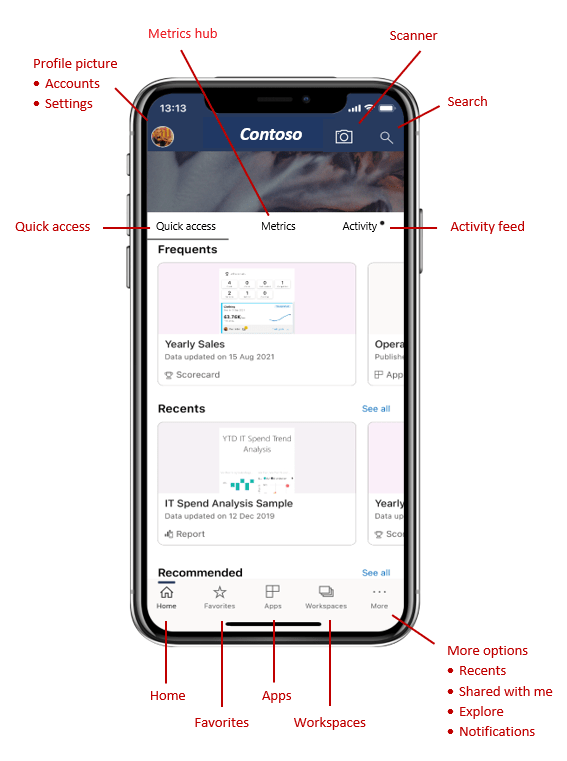
6. You have several ways to find your content from the home page:
- If you see your content in the Quick access tab, just tap it to open.
- You can tap the search icon in the header and type the name of the item that you’re looking for.
- You can tap the Favorites, Apps, Recents, or Shared with me options on the action bar to get a corresponding list of dashboards, reports, and apps to choose from.
- You can tap Workspaces on the action bar, which provides a list of workspaces that contain content that you can view. When you tap a workspace, you get a list of reports and dashboards in that workspace that you can choose from.
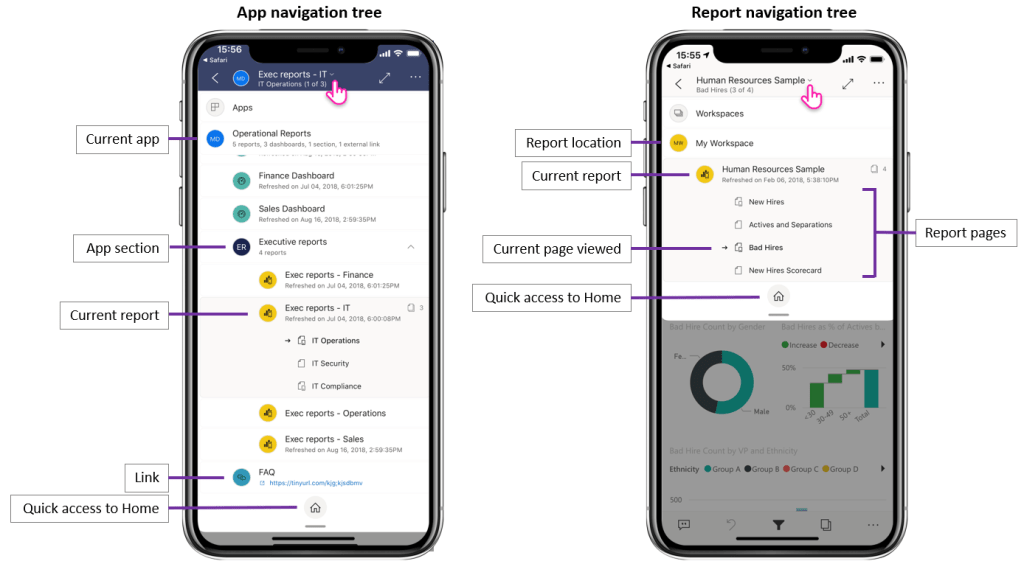
7. If the item you’re viewing is part of an app, the tree displays the entire contents of the app, such as sections, links, and all reports and dashboards. If the item you’re viewing is a report, you can also find a list of all visible report pages.
8. Whenever you come to a page that’s not optimized for mobile viewing, it appears as it does in the Power BI service. In such cases, you can rotate your phone to landscape orientation for a larger view, or you can just stay in portrait orientation and zoom in to view the data in detail.
9. You can switch between single-select and multi-select modes in the app settings,
10. You can long tap (tap and hold) a data point to display a tooltip on the point. The tooltip shows the values that the data point represents.
11. If drill up, drill down, or drill through have been configured on a visual, you can perform these actions by tapping and holding a data point on the visual.
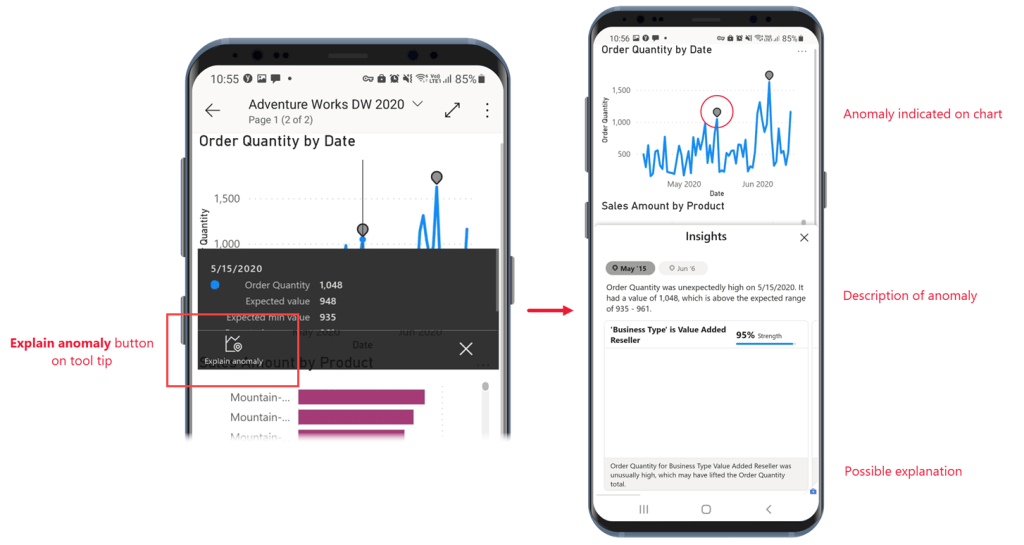
12. If a report creator has set up anomaly detection for a report visual, the tooltip on a data point has an Explain anomaly button that opens the Anomalies pane, where you can see if the unexpectedly high peaks and low dips in your data are caused by data outliers, and view possible explanations.
13.
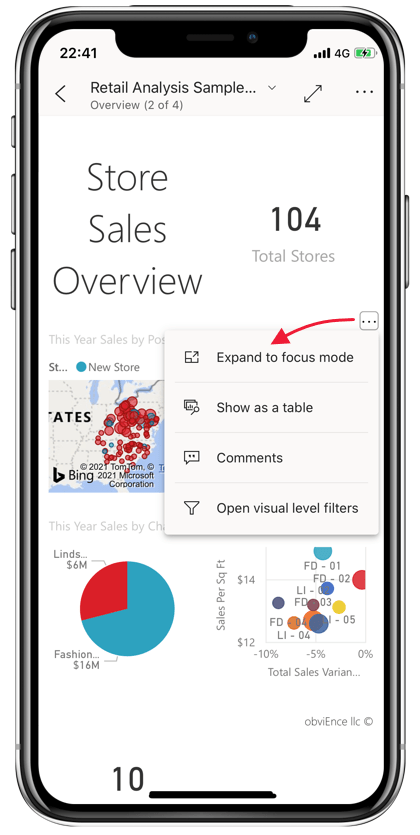
14.
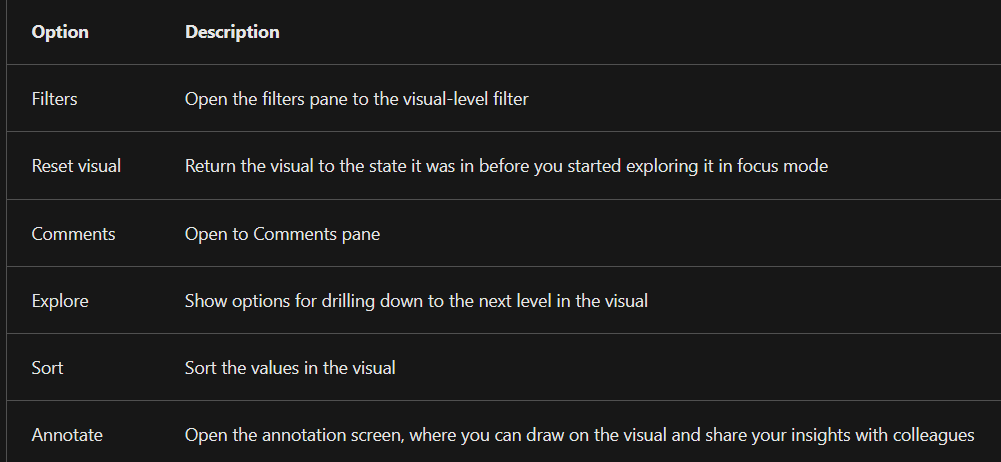
15. What you do in focus mode carries over to the report canvas and vice versa. For example, if you highlight a value in a visual and then return to the whole report, the report is filtered to the value you highlighted in the visual.
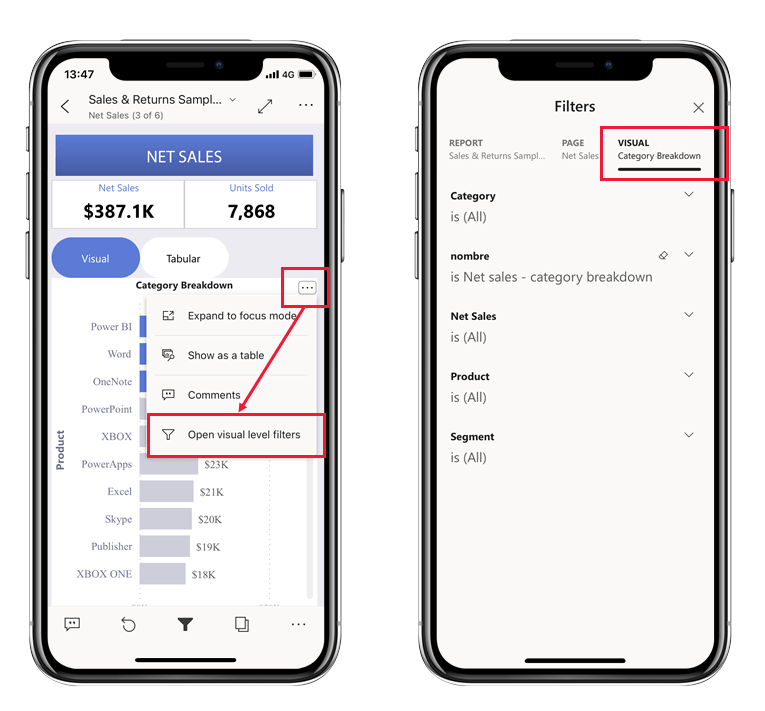
16. Filters view in Mobile
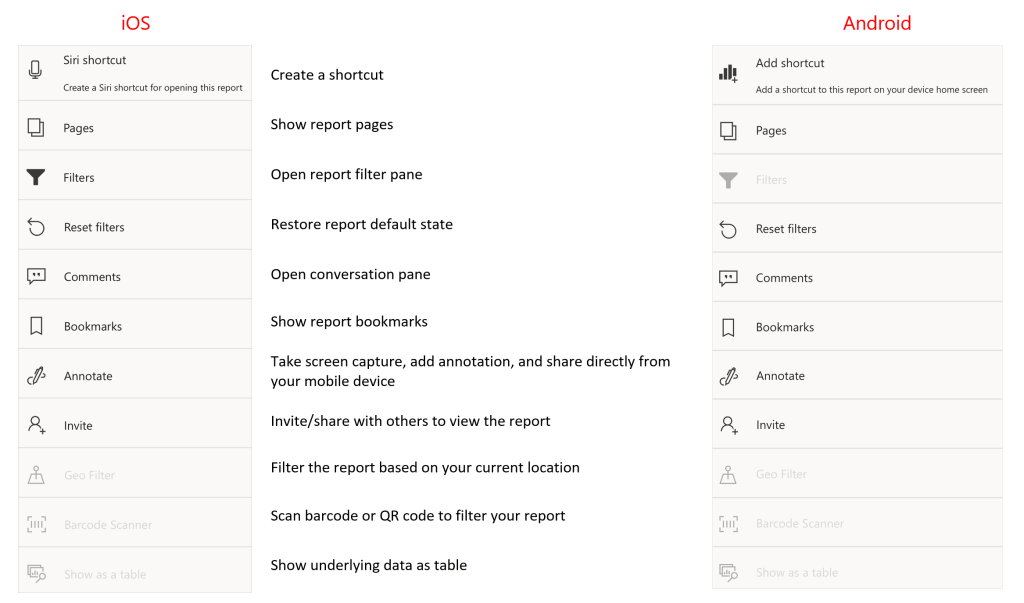
17. The report footer contains icons that you can use to perform common actions.
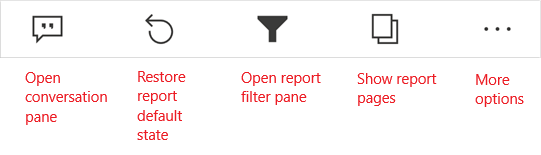
18. The More options (…) menu contains all report actions, both the common actions you see on the report footer as well as many other actions.
19. In Power BI Mobile apps, you can’t create bookmarks. You can only use them to display report views. Bookmarks are created in Power BI Desktop or in the Power BI service. There are two kinds of bookmarks: report bookmarks, which are created by the report designer, and personal bookmarks, which you as a report viewer can create yourself in the Power BI service. The mobile apps support both personal and report bookmarks.
20. Report data refreshes when you open a report. You can also refresh report data manually by pulling down slightly from top to bottom on the report page.
21. In the mobile apps, data is always refreshed with the data as it is in the Power BI service, never directly from the data source.
22. One advantage of viewing Power BI in a mobile app rather than in a mobile browser is that you can see your data even when you’re offline. While offline, you can access and interact with dashboards you’ve previously accessed from the mobile app.
In addition, you can also access any Power BI reports you’ve accessed previously. However, with a report, while you can see the full report when you’re offline, you can’t filter, cross-filter, sort, or use slicers on it.
23. To maximize your experience with the mobile app, you can create
- shortcuts and alerts,
- share reports and dashboards,
- play reports as slideshows, and
- use split-screen mode to multi-task with other apps.
24. You can create shortcuts to put on your Android device’s home screen. Select the Add shortcut option under the More options(…) menu on the report or dashboard’s footer.
25. While you’re on the go, you can set up alerts on dashboards in the Power BI mobile apps to notify you when data that you’re interested in has changed. Alerts that you set up on your mobile device are visible in the Power BI service. Likewise, in the mobile apps you’ll receive alerts that you’ve set up in the Power BI service.
26. On Windows devices, you can play a report as a slideshow that cycles through the report’s pages, bookmarks, or both, depending on what you choose. You can also set up your slideshow to start playing automatically whenever the app is launched. This feature is useful for creating kiosk-like experiences where you want your report to run in a public display without manual intervention.
27. There might be times when you want to view and interact with your data while working in another app, such as writing an email. If your iPad or Android tablet has multi-window support, you can open the two apps side by side.
28. You can get a filtered view of your data based on your location, and you can scan QR codes and barcodes to open reports and get filtered views of data.
29. A useful capability that the Power BI mobile apps offer is the ability to filter data by geographic location. When you’re out in the field, if the report that you need has geographical data, such as data for a particular city, state, or region, you can filter that report based on your geographic location
30. Open the report you want in the Power BI mobile app on your mobile device. If the report has geographic data, a message appears, asking you to allow Power BI to access your location. Select Allow and then tap Allow again. When the report opens, a pushpin icon displays.
31. Tap the pushpin. Now, you can filter by city, state/province, or country/region, depending on the data in the report. The filter only lists options that match your current location
32. Consider a scenario where you’re checking inventory in a large supermarket, and while you’re out in the aisles you need to get information about particular products, such as how many the store has in stock, what departments the items are stocked in, and so on. With the Power BI mobile app, you can open the Power BI scanner on your mobile device, scan an item’s barcode, and quickly get to the relevant report, already filtered to the data you need
33. First, you must have access to a report that included barcode data. This means that you or a colleague has created a report in Power BI Desktop that includes barcode data, and that the report has been published to the Power BI service and shared with you
34. Then, when you’re out in the field and come to a barcoded item whose report you want to see, you can open the app, tap Scanner from the More options (…) menu on the lower navigation bar, and then scan the barcode
35. Imagine you’re checking inventory in a large supermarket and while you’re out in the aisles you need to get information about particular products, such as how many the store has in stock, or what departments the items are stocked in. You can just open the Power BI scanner on your mobile device and scan an item’s barcode. You’ll get a list of reports that have barcode data. You choose the relevant report and the report opens, filtered to the relevant data.
36. Say the machines on a factory floor are identified with barcodes, and the telemetry from those machines is being processed and sent to Power BI. When engineers are out on the floor checking machine status, they can easily scan a machine’s barcode and get to a KPI report about its performance and status.
37. If there is only one report with a barcode field, you won’t get a list of reports, but rather the report will open directly, filtered according to the barcode you scanned. If the report doesn’t contain the barcode you scanned, you will get the message “Couldn’t filter report”.
38.
- If the Barcode icon is filled,
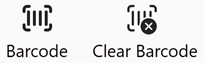 , the filter is active and the report is already filtered by a barcode.
 - If the icon is clear
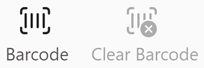 “, the filter isn’t active, and the report isn’t filtered by a barcode.
39. The mobile apps support Barcode filtering for reports that have only one barcode column across all report data tables. If you scan a barcode for a report that has more than one barcode column, no filtering takes place
40. Issues with scanning a barcode
- You get a message Couldn’t filter report – Looks like this barcode doesn’t exist in the report data
- You get a message Looks like you don’t have any reports that can be filtered by barcodes: This means you don’t have any barcode-enabled reports. The barcode scanner can only filter reports that have a column marked as Barcode.
41. Protect Power BI data with biometric identification – If you set up this feature, additional identification is required every time the app is launched or brought to the foreground. On iOS, the additional identification includes Face ID, Touch ID, or a passcode. On Android, you’d provide biometric data (fingerprint ID). You can set up biometric identification in the app settings
42. To customize your experience with the Power BI mobile app, you can configure numerous settings.
- Light and dark mode: If you prefer dark text against a light background or light text against a dark background, you can choose which mode to use, or you could continue with the mode that your system uses. For these types of changes, use the Appearance option in the app settings.
- Docked report footer: You might find that having the report footer available at all times is more convenient. Alternatively, you might prefer to have the report footer disappear when you’re not using it. You can choose what happens with the report footer by using the Docked report footer option in the app settings.
- Multi-select: You can have the effects of selecting a data point replace the effects of the previous selection, or you can view the cumulative effect of selecting multiple data points through the Multi-select option in the app settings.
- Button for refreshing reports (Android only): You can choose to have a refresh button on all report headers or to use the pull-to-refresh action by swiping down slightly from top to bottom on the report page. You can make these changes by using the Report refresh option in the app settings
43.
44. The best place to view and interact with your Power BI data while you’re away from your desk or out in the field.
45. Getting product inventory data by scanning barcodes of products on location.
46. Sharing filtered views of data with colleagues.
47. While you’re offline, you can access and interact with dashboards you’ve accessed previously from the mobile app. You also have read-only access to any Power BI reports you’ve accessed previously from the mobile app. While offline, you can see the full report, but you cannot filter, cross-filter, sort, or use slicers on it.
48.In the mobile app you can apply filters, but you can’t define them. Filters are defined in Power BI Desktop or in the Power BI service.
Discover more from LR Virtual Classroom
Subscribe to get the latest posts sent to your email.
