
Key pointers from the MS Learning path for PL-300
Manage workspaces and datasets in Power BI
1. Workspaces have the highest level of security maintained by controlling who can access semantic models, reports, and dashboards
2. By default, when creating a workspace, you provide the below basic details 1) Workspace Name 2) Workspace description 3) Workspace Logo image. Under the advanced option, you can add users to the contact list who will receive notifications if any issues in the workspace.
3. Workspace Onedrive – The Workspace OneDrive feature allows you to configure a Microsoft 365 Group whose SharePoint document library is available to workspace users.
Under Advanced > Workspace OneDrive, type the name of the Microsoft 365 group that you created earlier. Type just the name, not the URL. Power BI automatically picks up the OneDrive for the group.
Creating Microsoft 365 Groups may be restricted in your environment, or the ability to create them from your OneDrive site may be disabled. If this is the case, speak with your IT department.
4. Admin and Viewer Roles are straightforward with the highest and lowest access levels. The key difference lies in the contributor and member access.
5. Member role can add other users whereas contributors cannot. By default, members can publish, unpublish, and update the app whereas contributors can only update if given permission by Admin. Member role can Manage semantic model permission whereas contributor cannot.
6. Both member and contributor roles can 1) Create, edit, and delete content, such as reports, in the workspace and 2) Create a report in another workspace based on a semantic model in this workspace. 3)Publish reports to the workspace, and delete content. 4) Schedule data refreshes via the on-premises gateway 5) Modify gateway connection settings
7. Everyone can Create subscriptions to reports and subscribe to others to report whereas only the admin can manage the subscriptions created by others.
8. To copy a report to another workspace, and to create a report in another workspace based on a semantic model in the current workspace, you need Build permission for the semantic model. You also need at least the Contributor role on the source and destination workspaces.
9. Keep in mind that you also need permissions on the gateway. Those permissions are managed elsewhere, independent of workspace roles and permissions
10. If the items are in a workspace in a Premium capacity, you can view and interact with items in the Power BI service even if you don’t have a Power BI Pro license.
11. Members can add users to a workspace with lower permissions, but can’t remove users from any workspace roles.
12. Use the Viewer role to enforce row-level security (RLS) for users who browse content in a workspace. You can also enforce RLS without giving access to the workspace, publish an app and distribute it to those users, or use sharing to distribute content.
13. If one of the workspaces is in a shared capacity, everyone you add to it needs a Power BI Pro or Premium Per User (PPU) license. These users can all collaborate on the dashboards and reports in the workspace.
14. If you want to distribute content to others inside your organization, either assign Power BI Pro licenses to those users or place the workspace in a Power BI Premium capacity.
15. When the workspace is in a Power BI Premium capacity, users with the Viewer role can access the workspace even if they don’t have a Power BI Pro or Premium Per User (PPU) license.
16. A person with a Power BI Pro license can be a member of a maximum of 1,000 workspaces
17. Below are basic permission roles
- Admin
- Update and delete the workspace
- Add or remove people, including other admins
- Member
- Add members or others with lower permissions
- Publish, unpublish, and change permissions for an app
- Contributor
- Create, edit, and delete content, such as reports, in the workspace
- Publish reports to the workspace
- Viewer
- View and interact with an item
- Read data that’s stored in workspace dataflows
18. An app is a published, read-only window into your data for mass distribution and viewing. When ready to share apps with your users, you can publish the app. This process requires a Power BI Pro license. Consuming and viewing an app also requires a Pro license or the workspace must be hosted in a Premium capacity.
19. When creating the app, there are three tabs. 1) set up 2) Content 3) Audience.
20. Contact information and support site under Set up are mainly for help/support for the app.
21. Workspace users are automatically given access to the apps created within the workspaces. You can either allow them to share the dataset or allow people to build reports using the dataset.
22. In Power BI, you can create official packaged content, and then distribute it to a broad audience as an app.
23. Business users get your apps in a few different ways:
- They can find and install apps from Apps Marketplace or AppSource.
- You can send them a direct link.
- You can install it automatically in your coworkers’ Power BI accounts if your Power BI administrator gives you permission.
- If you distribute your app to external users, those users receive an email with a direct link. Power BI doesn’t send any email to internal users when you distribute or update an app.
24. Your app consumers can’t modify the contents of the app but can filter, highlight, and sort the data.
25. If the workspace for this app is not in a Power BI Premium capacity: All business users need Power BI Pro or Premium Per User (PPU) licenses to view your app.
26. you can decide if you want to allow app users who have build permissions to save copies of reports to their workspace. Once they save the reports, app users can customize their report copies to meet their needs.
27. When you publish an app, it includes all app content by default for each audience group. However, when you update an app, newly added content isn’t included by default.
28. You can copy a link to these items in an app: You can’t copy a link to an Excel workbook in an app.
- A Power BI report
- A paginated report
- A dashboard
- A scorecard
29. Consumers who have access to multiple audience groups see group tabs on the top bar to switch between different audience views easily. For example, if the user is part of both product team and sales team groups, they see three view tabs.
30. You need a Power BI Pro or Premium Per User (PPU) license to run and access the usage metrics data and can only be accessed by users with the role types of Admin, Member, or Contributor.
31. Viewers per day, Unique viewers per day (which doesn’t include users who returned to the same reports multiple times), and Shares per day charts.
- Total Views, Total Viewers, and Total Shares KPI cards
- Total views and shares ranking (compares how your report is doing in comparison to other reports in the app)
- Views by Users (details about each specific user that viewed the dashboard)
32. On the Report performance tab, you can view metrics such as:
- Typical opening time – How long it takes, at the fiftieth percentile, to open the report.
- Opening time trend – How the typical opening time changes over time. This metric can tell you how the report is performing as the number of users starts to grow.
- Daily/7-Day Performance charts – Highlight the performance for 10, 50, and 90 percent of the open-report actions every day and over a seven-day period.
- Filters for date, so you can see how the performance changes according to the day.
33. You can only run usage metrics reports in the Power BI service. However, if you save a usage metrics report or pin it to a dashboard, you can open and interact with that report on mobile devices.
34. Usage metrics reports don’t show up in Recent, Workspaces, Favorites, or other content lists. They can’t be added to an app. If you pin a tile from a usage metrics report to a dashboard, you can’t add that dashboard to an app.
35. The improved usage metrics report includes the following report pages:
- Report usage Provides information about report views and report viewers, such as how many users viewed the report by date.
- Report performance Shows the typical report opening times broken down by consumption method and browser types.
- FAQ Provides answers to frequently asked questions, such as What is a “Viewer” and what is a “View”?
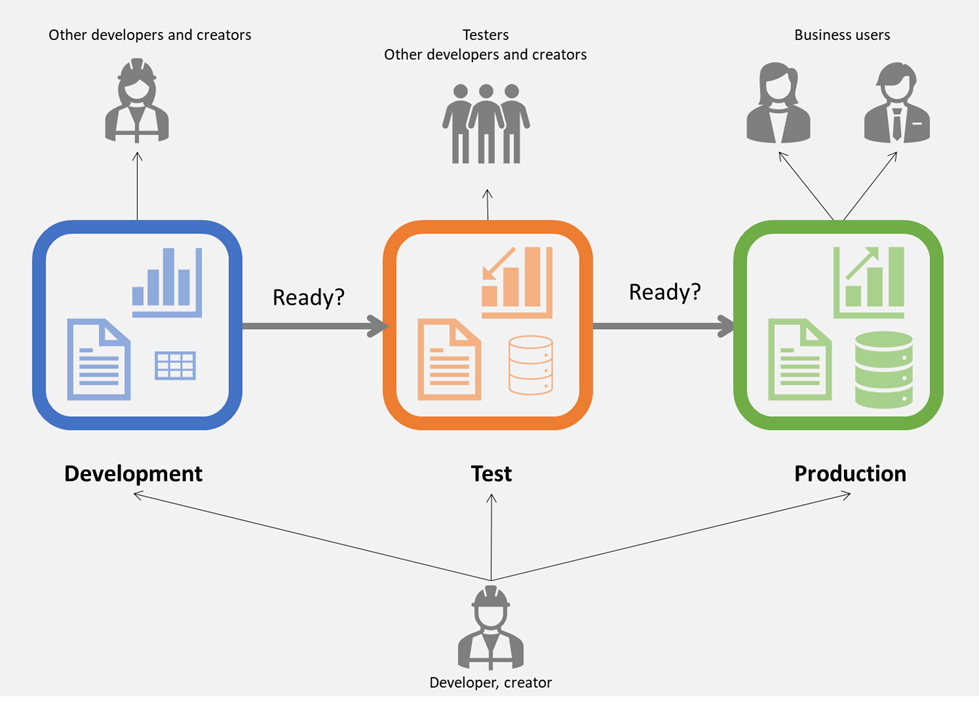
36. The deployment pipeline feature in Power BI manages content in dashboards, reports, and semantic models between different environments in the development life cycle. Deployment pipeline (Premium).
37. The advantages of using the deployment pipeline are:
- Increased productivity – Through this feature, you can reuse previous deployment pipelines, ensuring that efforts aren’t duplicated.
- Faster delivery of content – Report development becomes more streamlined, meaning that it takes less time to get to production.
- Lower human intervention required – Having the ability to reuse deployment pipelines means a decreased chance of error associated with moving content from one environment to another.
37. Only workspaces that are assigned to a Premium capacity will appear while creating development pipleines. Additionally, you can only assign a single workspace to each pipeline. Power BI will auto generate the two other workspaces that are used in the pipeline.
38. After you have collaborated with the teams and built a testing-ready report, you are ready to proceed to the testing phase. Select Deploy to test, which will create a new workspace. This workspace, by default, has the same name as the initial workspace but includes the [Test] suffix.
39. The Lineage view feature in Power BI allows you to quickly refresh semantic models and see the relationships between the artifacts in a workspace and their external dependencies. Products team, it has become increasingly difficult to track which reports need to be refreshed and which semantic models are in which report. Data lineage refers to the path that data takes from the data source to the destination.
40. The Lineage view feature in Power BI is crucial because it:
- Simplifies the troubleshooting process because you can see the path that the data takes from source to destination and determine pain points and bottlenecks.
- Allows you to manage your workspaces and observe the impact of a single change in one semantic model to reports and dashboards.
- Saves time by simplifying your task of identifying reports and dashboards that haven’t been refreshed.
41. The Lineage view is only accessible to Admin, Contributor, and Member roles. Additionally, it requires a Power BI Pro license.
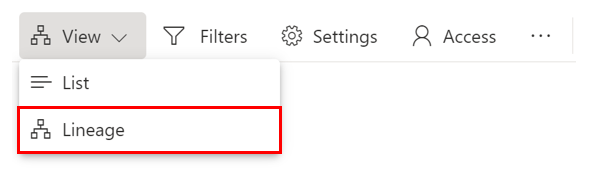
42. Under View settings, List or Lineage
43. the flow would be data sources > semantic models/dataflows > reports > dashboards. if you double-click the card, you will get more details about the data source, such as the file path and the connection status
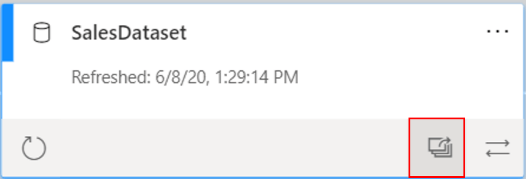
44. You wanted to determine if the company had stale semantic models and then quickly refresh the data. By using the Lineage view feature, you can go through the different semantic models in one view and then use the Refresh data button to refresh semantic models that you determine as stale.
45. Additionally, if a semantic model or dataflow belongs to a different workspace (in this case, the Tailwind workspace), it will be indicated on the card, as shown in the following screenshot.
46. By double-clicking on any card, you can view the metadata, such as the sensitivity, by whom it was configured, the last refresh date, and the names and count of tables within this semantic model.
47. You can also view the impact of this semantic model across workspaces. By selecting the overlapping window icon on the lower-right corner of a semantic model card, you can determine the impact analysis of the semantic model.
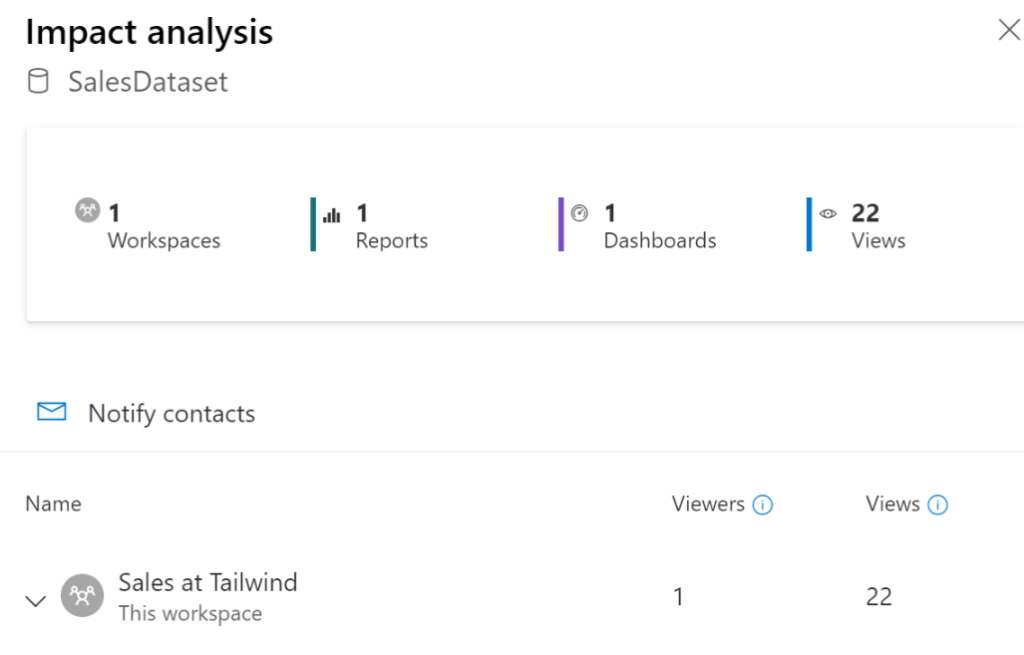
48. Selecting the card will get the metadata of the datasource. However, there are three icons for each card on the lineage view. 1) Refresh icon 2) highlight the path from data source to destination 3) impact analysis.
49. Sensitive data is secure – None, Personal, General, Confidential, and Highly confidential.
- Use Microsoft sensitivity labels to label dashboards, reports, semantic models, and dataflows by using the same taxonomy that is used to classify and protect files in Microsoft 365.
- Add more protection measures such as encryption and watermarks when you are exporting the data.
- Use Microsoft Cloud App Security to monitor and investigate activities in Power BI.
50. An Azure Information Protection Premium P1 or Premium P2 license is required to apply or view sensitivity labels from Purview Information Protection. Azure Information Protection can be purchased either standalone or through one of the Microsoft licensing suites.
51. Sensitivity labels from Microsoft Purview Information Protection on your reports, dashboards, semantic models, dataflows, and .pbix files, paginated reports can guard your sensitive content against unauthorized data access and leakage. Labeling your data correctly with sensitivity labels ensures that only authorized people can access your data. It is not applicable for template apps and workbooks.
52. You must have a Power BI Pro or Premium Per User (PPU) license and edit permissions on the content you want to label. Note: If you have a Free license, you can only apply sensitivity labels to items in your My workspace (provided that the other requirements listed here have been met); you won’t be able to apply them to items in any other workspace. Sensitivity labels must be enabled for your organization.
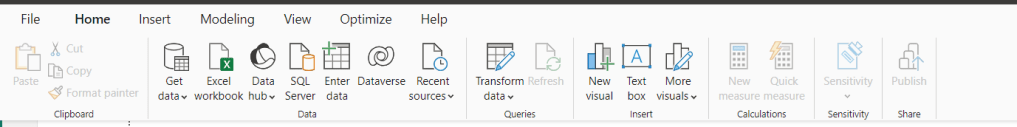
53. Apply sensitivity in Power BI edsktop from Home Menu.
54. How is the Admin workspace role different from other types of workspace roles? Admin is the only role that can remove any users.
55. Some useful tips about working with workspaces.
- Use granular workspace roles for flexible permissions management in the workspaces: Admin, Member, Contributor, and Viewer. Read more about workspace roles in this article.
- Contact list: Specify who receives notification about workspace activity. Read more about workspace contact lists in this article.
- Create template apps: You can create template apps in workspaces. Template apps are apps that you can distribute to customers outside of your organization. Those customers can then connect to their own data with your template app. Read the article about template apps.
- Share semantic models: You can share semantic models between workspaces. Read more about shared semantic models.
56. Users without a Pro or Premium Per User (PPU) license can access a workspace if the workspace is in a Power BI Premium capacity, but only if they have the Viewer role.
57. Assign user groups to workspace roles: You can add Active Directory security groups, distribution lists, or Microsoft 365 groups to these roles, for easier user management.
58. Pipelines enable a continuous integration/continuous deployment (CI/CD) approach that ensures content is updated, well-tested, and regularly refreshed as needed. Pipelines are an efficient and durable way to automate the movement of content (reports, paginated reports, dashboards, semantic models, and dataflows) through the development, test, and production stages of the content development lifecycle
59.A workflow view is helpful to review.
60. On the drop-down list, the user will only see premium capacity or PPU workspaces 1) that are not assigned to any other pipeline, 2) where the user is their admin, and 3) where the user is a member of their adjacent stages.
61. You can’t deploy a Power BI item to the next stage if the items it’s dependent on don’t exist in the stage you are deploying to. For example, deploying a report without its semantic model will fail, unless the semantic model already exists in the target stage.
62. Deployment rules – While working in a deployment pipeline, different stages may have different configurations. For example, each stage can have different databases or different query parameters, or the development stage might query sample data from the database, while the test and production stages query the entire database.
63. Power BI uses Microsoft Entra ID to authenticate users who sign in to the Power BI service. Sign in credentials are required whenever a user attempts to access secure resources. Users sign in to the Power BI service using the email address with which they established their Power BI account. Power BI uses the same credentials as the effective username and passes it to resources whenever a user attempts to connect to data. The effective username is then mapped to a User Principal Name and resolves to the associated Windows domain account against which authentication is applied.
For organizations that used work email addresses for Power BI sign-in, for example david@contoso.com, the effective username to UPN mapping is straightforward. For organizations that didn’t use work email addresses, for example david@contoso.onmicrosoft.com mapping between Microsoft Entra ID and on-premises credentials requires directory synchronization to work properly.
Discover more from LR Virtual Classroom
Subscribe to get the latest posts sent to your email.
