
Microsoft Excel includes a powerful feature called Power Query—also known as Get & Transform or Get Data—which provides fast and powerful data gathering and cleansing capabilities.
A biggest advantage of Power Query & Power Pivot is, you can have large amounts of data compressed and stored in memory to transform and analyze anytime for creating dashboards, all within Excel itself.
Let’s deep drive into the below topics one by one.
- IMPORT & ANALYZE MILLIONS OF ROWS
- BUILD DATA MODELS FROM VARIOUS SOURCES
- AUTOMATE YOUR DATA PROCESS
- ADVANCED CALCULATIONS
- CREATING A ROLLING CALENDAR
- INDEX, CONDITIONAL & GROUPING COLUMNS
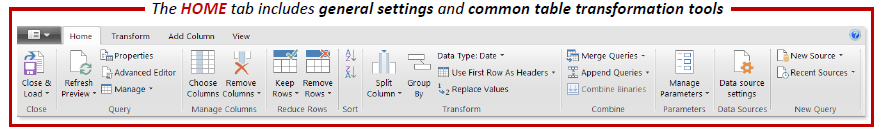
Below is the set of options available in Excel for Power Query Editor:
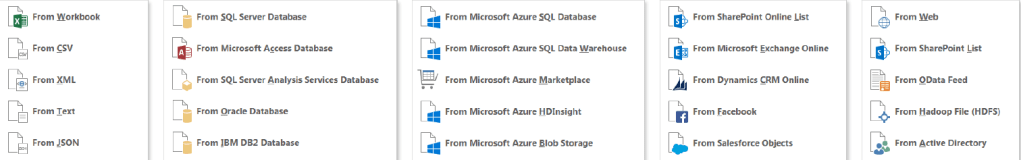
IMPORTING DATA FROM VARIOUS SOURCES:
It’s a very, very consistent and user friendly process no matter what source you’re connecting to. So whether you’re connecting to a SQL server, or loading up a CSV file once you’ve made the connection, it requires authentication, or user credentials to access. Once you’ve made that initial connection the rest of the process is identical.
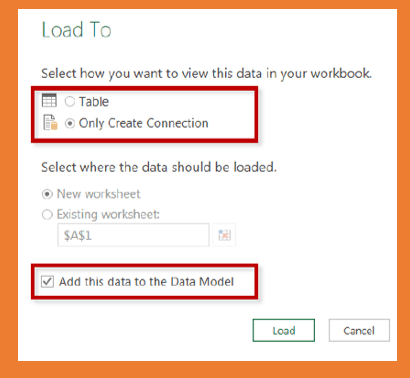
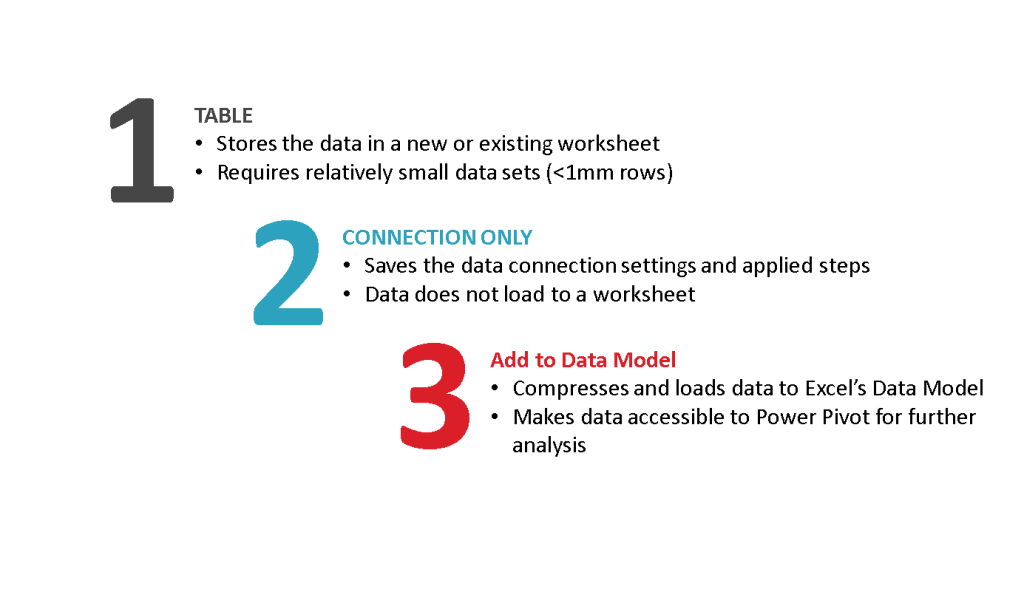
DATA LOADING OPTIONS:
Instantly connect sources and analyze holistic performance across your entire data model. There are three ways you can load the data into excel.
Tip – 1: – Always ensure you select ” Only Create Connection” & Also Check out the ” Add this to Data model box” when you click “close and load to”
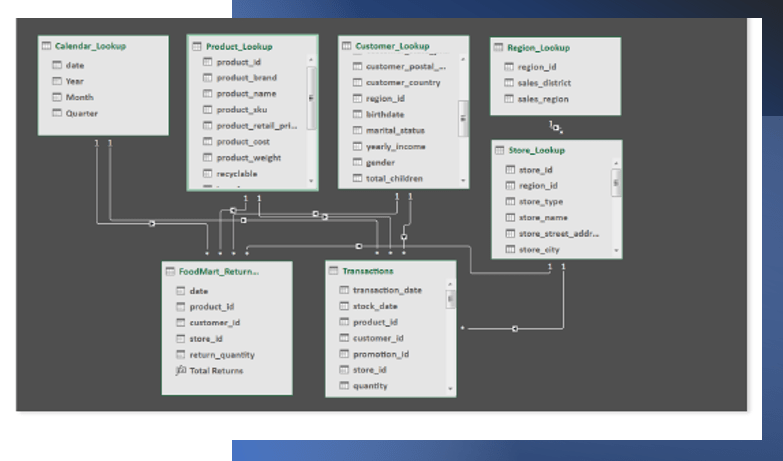
BUILD DATA MODELS:
Connect to databases and watch data flow through your model with the click of a button. Its very important to know that you can build relationships between the tables by using their common fields in the tables called key”.
- Primary Keys – Uniquely identify the each row of a table
- Foreign Keys – Information in the related data tables which multiple instances of each value and used to match to the primary key.
Tip – 2: – No need to manually stitch the tables, you can automate by building relationships, to do further analysis between tables.
Also suffix the name of the table as “Lookup” and “Transactions” to differentiate for ease.
The diagram view in the data table which allows you to create connections between tables.
AUTOMATE YOUR DATA PROCESS:
Refer the post on A-Z of Power Query, to know the list of various functions we can perform in Power Query.
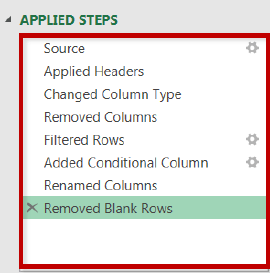
We can filter, shape, transform your raw data before loading it into the data model. Each activity is recorded and saved automatically. As and when you perform the steps, the M code is automatically generated as shown below.
You can click on each of the steps to see the analysis and also edit or delete the step if required and then “close and load” the table again to apply changes made.
The process is repeated whenever the data source is refreshed – like a macro.
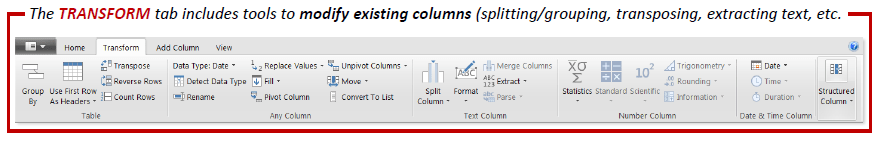
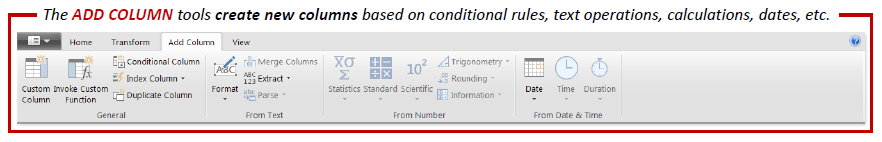
Tip – 3: You can access many of these tools in both the “Transform” and “Add Column” menus -the difference is whether you want to add a new column or modify an existing one

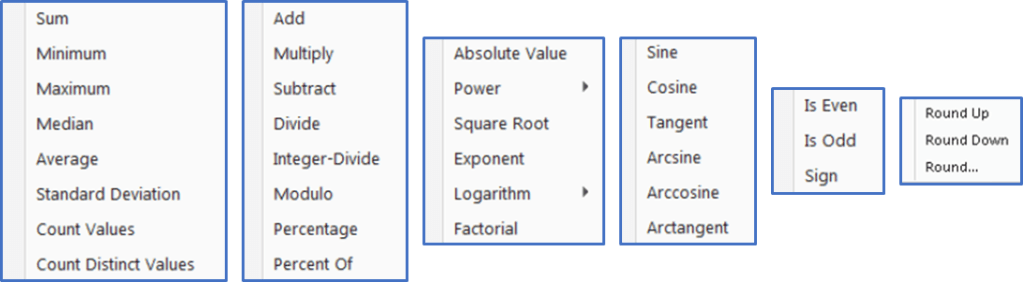
ADVANCED CALCULATIONS:
You can perform lot many calculations as shown below. You name it , it has it. All the below calculations are added as part of the “Add columns” under transform menu.
There is difference between the calculated column and the measure column which you create using DAX. The key difference is calculated columns appear as part of the data model itself. Measures are available when you insert the pivot table fields.
Tip – 4: Use “Trim” to eliminate leading & trailing spaces, or “Clean” to remove non-printable characters
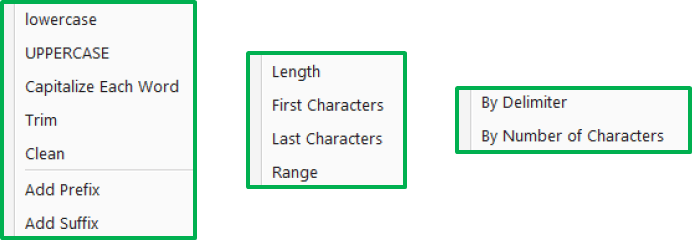
Tip – 5: Select two or more columns to merge or concatenate fields
Creating a Rolling Calendar:
Creating a calendar table is mentioned in the A-Z about Power Query. Instantly, by copy and paste, you can create table calendar in a click of a button.
What if you want to create rolling calendar based on the source data table dates.
It might be difficult to constantly update calendar table or loading up a calendar that goes way out into the future automatically?
Say you want to create date table starting from 2021 to whatsoever date year in your source data say 2022 and then 2024 when you have more data in 2024.
You don’t need to update or refresh the calendar table for every date year change. Just follow the below steps. Create a new, blank query (Data> New Query > From Other Sources > Blank Query)
- In the formula bar, generate a starting date by entering the below code.
=#date(2021,1,1)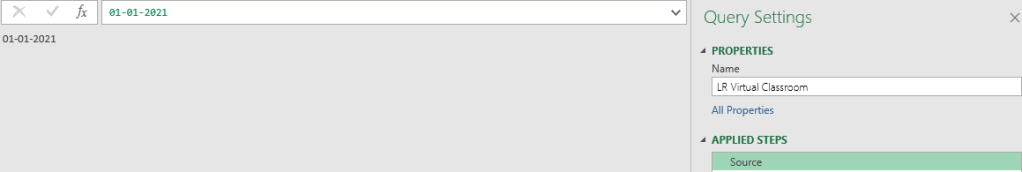
2. Click the fX icon to add a new custom step, and enter the following formula exactly as shown:
= List.Dates(Source, Number.From(DateTime.LocalNow()) - Number.From(Source), #duration(1,0,0,0))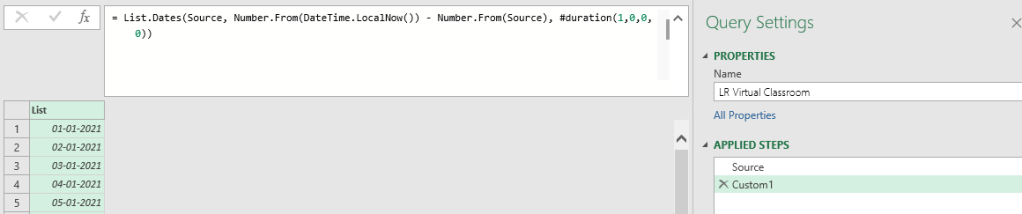
3. Click “To table” on the left hand side of the menu to convert the query into a new table to your source data.
Tip – 6: Load up a table containing a single date column and use Date tools to build out an entire calendar table
INDEX, CONDITIONAL & GROUPING COLUMNS:
As we know that INDEX COLUMN is a a list of sequential values that you can use to identify each unique row in a table. Just click Add Column – > Index Column to add the additional new column to your data model.
You can select to start with a zero or a one. These are often used to create unique ids that can be used for any analysis. You can use it as transaction Id as well.
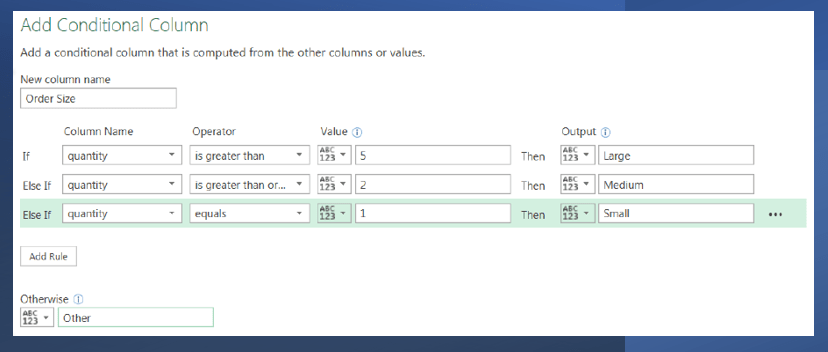
Conditional Column allows you to define new fields based on logical rules and conditions (IF/THEN statements).
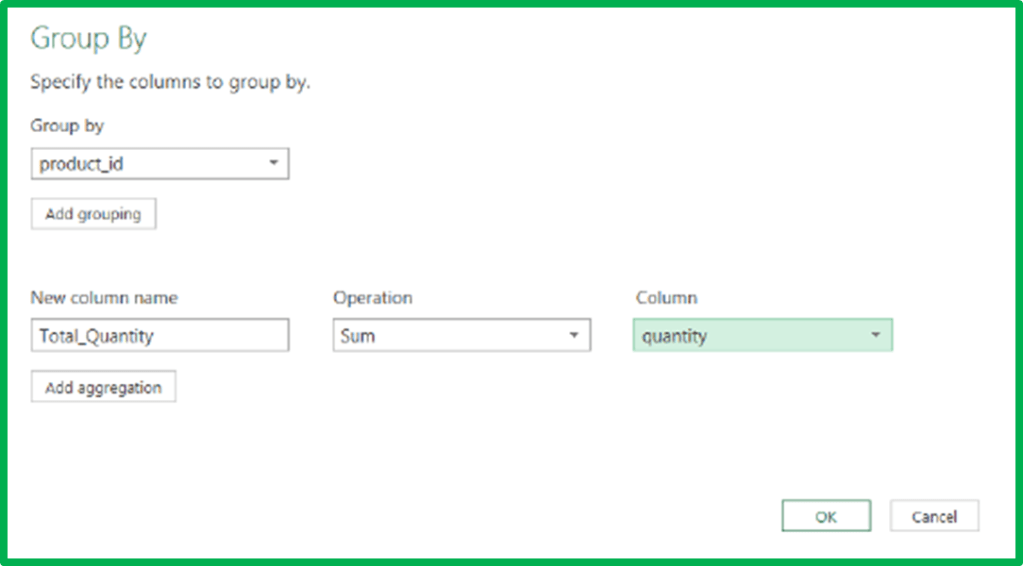
Grouping data column allows you to aggregate your data at a different level
(i.e. transform daily data into monthly, roll up transaction-level data by product etc.)
Tip – 7: Caution to note that you will lose out all other columns in your table when you perform grouping. Only the Product Id and Quantity will be retained in our example.
Stay tuned on DAX Measures and Power Pivot!!
Discover more from LR Virtual Classroom
Subscribe to get the latest posts sent to your email.
