
As you know Power BI is a collection of software services, apps that work together to help you create, share dashboards.
The Microsoft Power BI service (app.powerbi.com), sometimes referred to as Power BI online, is the SaaS (Software as a Service) part of Power BI. In the Power BI service, dashboards help you keep a finger on the pulse of your business data.
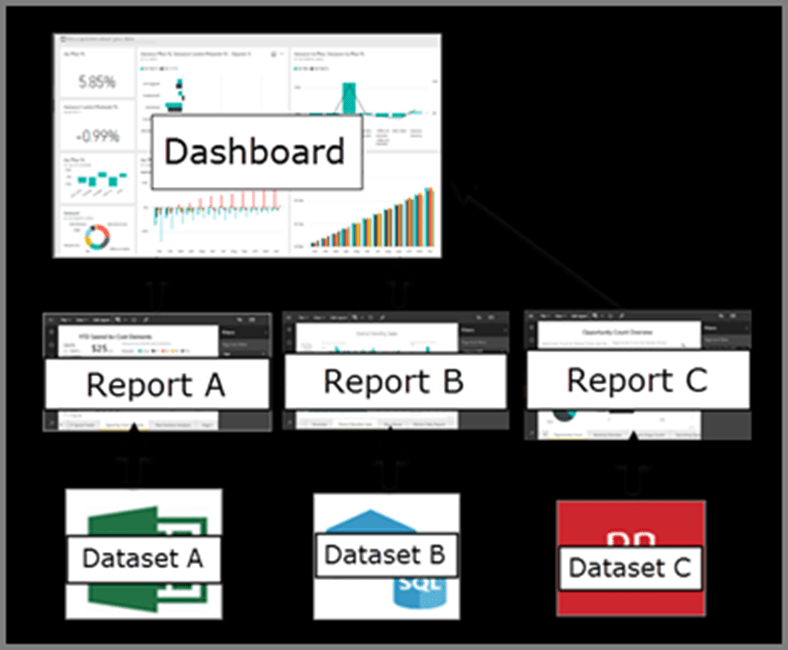
Dashboards display tiles, which you can select to open reports for exploring further. Dashboards and reports connect to datasets that bring all of the relevant data together in one place. All these combine together to tell a story about the insightful data.
Why Power BI Service:
Below are the steps that you follow in Power BI Service:
- Get some data and open it in report view.
- Use that data to create visualizations and save it as a report.
- Create a dashboard by pinning tiles from the report.
- Add other visualizations to your dashboard by using the Q&A natural-language tool.
- Resize, rearrange, and edit details for the tiles on the dashboard.
- Clean up resources by deleting the dataset, report, and dashboard.
How to Sign Up for Power BI Service:
- Sign in to your Power BI online account, or sign up, if you don’t have an account yet. Microsoft has listed the step by step procedure to create Power BI account using personal account.
- https://docs.microsoft.com/en-us/power-bi/admin/service-admin-signing-up-for-power-bi-with-a-new-office-365-trial
Functionalities of Power BI service:
- Q&A
- Quick insights
- Analyse In Excel
- Power BI Apps builder
- Paginated Reports
- Email subscriptions
- Data alerts
- Cross-report drill through
How Dashboard works in Power BI service:
Dashboard that is created in Power BI Service can pin visualizations from various reports and in turn various data sets.
Create your own dashboards from three different reports created by your team members and share with your customers.
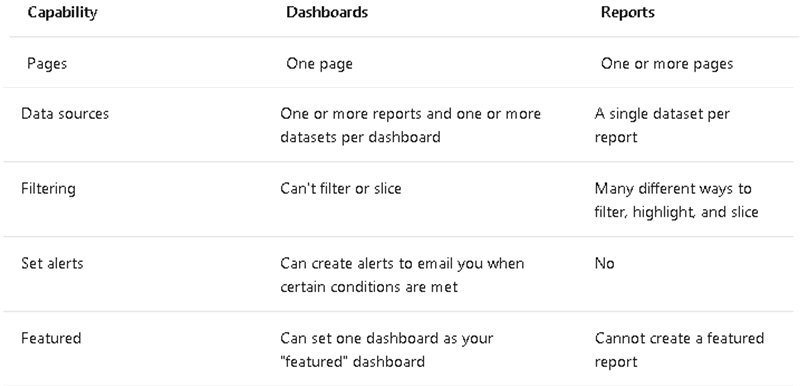
What is Dashboards vs Reports:
Components of PowerBI Service:
My workspace is the personal workspace for any Power BI customer to work with your own dashboards.
A dataflow helps organizations to unify data from disparate sources. They are optional, and are often used in complex or larger projects. Dataflows are not available in my-workspace in the Power BI service
A Power BI report is one or more pages of visualizations such as line charts, maps, and treemaps. Visualizations are also called visuals.
A dashboard is something you create in the Power BI service or something a colleague creates in the Power BI service and shares with you.
App is a collection of dashboards and reports built to deliver key metrics to the Power BI consumers in your organization. Apps are interactive, but consumers can’t edit them.
Why Create Apps for your own Organisation in Power BI service:
Promote your company by using the Microsoft brand. An app is a collection of preset, ready-made visuals and reports that are shared with an entire organization. For example, when you use the GitHub app, Power BI connects to your GitHub account (after you provide your credentials) and then populates a predefined collection of visuals and dashboards in Power BI.
With Power BI apps, now in preview, you can easily deploy a collection of purpose-built dashboards and reports to a large number of business users and empower them to make data-driven decisions.
End users need Power BI licenses to consume these apps. But if the app content resides in Power BI Premium capacity, end users can access the content without requiring a Power BI Pro license.
Sign up for Power BI service and create insightful dashboards and tell story about your data.
Hope you found the post informative. Your valuable feedback, question, or comments about this post are always welcome by leaving me message on contact form is truly appreciated.
Discover more from LR Virtual Classroom
Subscribe to get the latest posts sent to your email.
