During the Honeywell days, I have extensively worked in the SAP – Project Systems which gave me exposure to connect the dots in the E2E (End-to-End) project management in terms of scope, schedule, budget, resources, quality, risk, issues, change request, communication, reporting, phase gates etc. The tool had the concept of various T-codes which you run for various purposes.
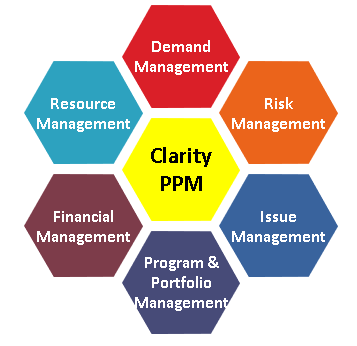
Recently I got an opportunity to work in a PPM (Project and Portfolio Management) tool called Clarity. Trust me, the tool is very intuitive and anyone with End-to-End program management understanding will be able to work with this tool.
It is very important to have the individual projects linked to the Parent Program code for effective management and have a birds-eye view.
Refer the post Key Program Management Terms for various clarity related fields and their definitions.
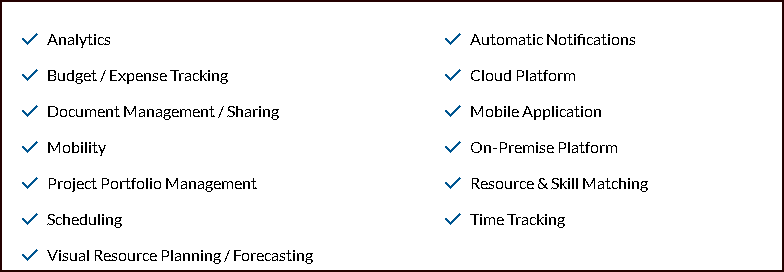
Here’s the snap bits of the tool which will be good reference for anyone.
It is strongly recommended that clarity plan is always opened in the Open Work bench (OWB) in the clarity interface or directly from the window start window.
Within the clarity, you can use “Open a scheduler”, then click “Read/Write” workbench to open the project.
Some things to remember while using OWB:
- Project will lock in clarity when its checked out and so no one can update the plan in clarity when its open in workbench. The lock is retained until the project is checked back in and you close out of OWB.
- There is no Autosave in OWB -so remember to click on save periodically to save the plan back to clarity.
- You need to have the plan in clarity before time posting occurs – for pending ETC’s and actuals.
- Resources are controlled by clarity – you should never manipulate data (Resource Id, Name etc.) or the plan will not be accepted back into clarity.
Setting Open Workbench Options:
In open workbench you can set program options for your workstation. From the file menu, select “Preferences”
Key options to note before you start working on the project:
- In the default tab, update the default dependency between the task like FS, SS, FF, SF and default unit as resource (days or hours).
- In the WBS tab, update the milestone label, task labl and Summary levels label as below.
- Milestone Label – Milestone
- Task Label – Task
- Summary Levels Label – Phase, Activity, WBS Level3, WBS Level4 etc.
Navigating in Open Workbench:
When you open multiple projects, you will see multiple tabs at the top of the screen. The following windows are see in the OWB – Task details, Resource details, Gantt area.
There are different views under the category Planning, Executing, Controlling. You can create your own views as well.
Double click in the time scale title area to change the time scale of the gantt chart.
Hide/Unhide the view shortcuts bar in the left hand side by select/deselect in the preferences of the General tab.
Manipulating the Work Breakdown Structure in OWB:
- Phase are the major steps required to achieve the projects goal. Most well defined projects have multiple phases with specific objectives.
- You can define activity (Sub Task) leading to the completion of the phases.
- You can further divide each activity into tasks – the smallest component in the project
- Milestones mark significant events or dates used to measure to project’s progress.
- Milestones have no duration and no work effort. Milestone status should be either “Not Started” or “Completed”.
Copy / Paste:
- You can copy a singe task row, the tasks resource assignments are copied but not dependencies.
- You can copy multiple task rows, the tasks resource assignments and dependencies are copied.
Task Properties:
The fastest way to work with the WBS is from a spreadsheet view, such as Gantt chart or WBS definition view.
By default, when you create new tasks, OWB assumes it is task. You can change teh level of the WBS anytime as you defined under Preferences.
Below the list of Task Properties you need to know:
- Category – Used to indicate which Phase the task/milestone belongs to.
- ID – Task ID prepopulated for each tasks and milestones.
- Type – Task type is any of the option like Phase , Activity, Task or milestone.
- Duration – No of working days it takes for the task to complete. This can be autoscheduled if it is not a fixed duration task.
- Fixed – If checked, the duration of the task is locked.
- Priority – 0 to 36 – 0 is the highest. Default is 10.
- Inherited – If checked, this will inherit the priority of the parent task like activity or phase.
- Baseline Start / finish date – once baselined, the dates will appear here.
Building Task Dependencies:
Logical relationship between tasks and milestones are called as dependencies. There are four types of dependency links like Finish Start, Start-Start, Finish-Finish, Start-Finish.
There are three ways to create dependencies in the OWB.
- Right click the task – select dependencies
- Drag the task/milestone to another task.
- Under Task properties, select the appropriate dependencies.
Assigning resources to Tasks and Entering ETC’s:
Once you have your work breakdown structure ready, the next step is to ad resources to the task. Resources & roles are created and maintained centrally in clarity. Assign the individual resources and estimate the amount of effort required.
There are three different ways to add resources to the tasks:
- Using resource assignment view from the planning group.
- Using the task properties dialog box – From the project resources list, click name of the required resource and then click assign.
- From the resources section of the task dialog box, select the resource to be removed from the assigned resource section and click release.
Using Autoschedule:
Once the WBS, dependencies, resources, roles & efforts are planned, next step to identify the critical path of the schedule.
To identify the critical path, OWB needs the below:
- Dependency sequence
- Work effort ETC
- Resource availability
- Resource allocation
Select Tools-> Autoschedule,
- The start date will be default to todays date. But you can also impose future date.
- You can schedule just portions of the plan.
- When the resource constraints checked, OWB will not over allocate resources.
- Deselect this option to have OWB over allocate resources for schedule compression.
- You have an option to schedule from the finish date as well just like in MS Project.
- Stat successor on next day option will enable a lag of 0 to start on the next day after the predecessor task finishes.
Setting a Baseline:
Baseline is a process that saves a snapshot of the project at the time the baseline is taken. This snapshot allows the PM to compare the current status of the project plan against what was planned.
Select Project-> Baseline->Define from the menu bar or click the baseline button on the toolbar.
There are three option to baseline:
- Baseline the entire project
- Baseline only the items on the view
- Baseline only the selected tasks
Multiple Baseline:
Project->Baseline-> Manage from the menu bar, which opens the Multiple baseline dialog box where all existing baselines are visible.
To create a new baseline, select New.
Mark the current checkbox if you want the associated baseline to serve as the current baseline.
Using & Manipulating Views:
Views are comprised of elements or attributes in the OWB. You can add a column, add a data field, delete a column, format an attribute by click on the format cell button. Fonts, colors, symbols are found under highlights in OWB.
Risks/ Issues/ Changes/Dependencies:
The tool has a tab for effective RAID management. For details about the fields that are available in the clarity, refer the post on Key Program Management Terms.
Reporting:
There are various reports that can be extracted from clarity for a particular project or group of programs. Status report, financials, resource allocation, timesheet, key risk, issues, change request, dependency, tasks & milestones etc. were the various sections where one can extract the data from the clarity.
Power Filters:
When you want to extract large amount of data say at OBS level, portfolio level, you can use Power Filters to create your own reports. By using clarity fields with combination of the AND / OR condition, you can create your own POWER QUERY and generate the report.
Filters & Layouts:
Creating your own filters and layouts is the first thing you need to do before reporting it out. It will ease your recurring process and helps to slice and dice the date however you want in Excel.
Clarity Status Reports:
Don’t forget to check out this post on the Status Reports and its characteristics.
Below elaborated on the various clarity fields that are available as part of the Clarity Status reports.
| Terminology | Explanation |
| Project Name | Project names are unique and ease of understanding the program delivery |
| Project ID | Unique Id for the project against which all the references are made including the cost accumulation. |
| Report Date | The date on which the report is published. Ensure the dates are updated with current date to avoid the confusion on the outdated information. |
| Overall RAG Status | Reflects the overall status of the programme. Red, Amber, Green. The threshold for the RAG is defined by each organization. It accounts for the scope, schedule, cost, quality aspects of the project. |
| Path to Green | Path to green if the overall status is Red or Amber and details what actions are taken to return to green. This captures the key risks & issues in the programme. This will help to understand and track the project and provide support if required by the portfolio. |
| Date to Green | This marks the estimated date when the project will be back on track (Green RAG). |
| Overall / Executive Summary | Reflects the current position of the program summarized in 2-3 paragraphs as on current status report date. The RAG should be justified, Path to Green should be called out and abbreviations are explained. |
| Upcoming Milestones | Call out the next upcoming key programme milestones in the next 2-3 months. This gives a view of roadmap of the program. |
| Key Activities Next Period | A summary of the planned key activities for the program in the next reporting period. |
| Achievements Last period | Summarizes the key 5-7 achievements from the last to current reporting period. |
| Items for Management Attention | Any points of escalation for management attention |
| Expected Trend for the next reporting period | Mention the expected Overall Program RAG for the next reporting period ( typically next month) to know the program trending. This aids in decision making. |
| Milestone Status Dashboard | Provide the quantitative status of No. of milestones that are Completed, On track, At risk, Missed etc. |
| Support from Management | This field is important to let know in ahead for the support needed from Portfolio Manager / Sponsor. Project management itself a collective team work and as a manager, it is important to put forth the support required before things go out of hand which will impact the customer satisfaction score. |
| Terminology | Explanation |
| Schedule RAG Status | Mention the RAG status for the schedule – This accounts for performance of the key deliverables and milestones. The key misses and current risks are to be considered while providing the RAG. |
| Schedule Variance | Call out the explanation for the schedule variance if the RAG is Amber or Red. |
| Scope RAG Status | Mention the RAG status for the scope – This accounts for the scope progress compared to the initial phase. The key changes to the program scope to be considered as well. |
| Scope Variance | Call out the explanation for the scope variance if the RAG is Amber or Red. |
| Cost & Effort RAG Status | Mention the RAG status for the Cost & Effort – This compared the actual cost/efforts to the planned cost/efforts. |
| Cost & Effort Variance | Call out the explanation for the cost & effort variance if the RAG is Amber or Red. Highlight the factors for the increase in the forecast cost than original baseline. |
| Resource RAG Status | Mention the RAG status for the resources – This accounts for planned vs actual resources deployed in the programme. |
| Resource Variance | Call out the explanation for the resource variance if the RAG is Amber or Red. Highlight the factors for the deployment of resources and any risks/issues in terms of resources. |
| IT RAG Status | Mention the RAG status for the IT scope – This accounts for any IT related issues/support that are needed for the smooth execution of the programme. |
| IT Variance | Call out the root cause of the IT specific risks/issues. |
This post is a perfect bookmark for me. Hope you find this useful as well.
Discover more from LR Virtual Classroom
Subscribe to get the latest posts sent to your email.
