
I recently learned about rich filters in Jira, and they’ve been incredibly useful for managing our projects more effectively. These filters allow us to create highly customized searches using JQL (Jira Query Language), which is great for tailoring views to our specific project needs. For instance, we can filter issues by project, issue type, status, assignee, and more, making it easier to track progress and manage tasks.
Jira Rich Filters are powerful tools that allow users to create complex queries and customize the display of Jira issues flexibly and dynamically. Unlike standard Jira filters, Rich Filters enable you to add gadgets and create dashboards that can visualize your data more effectively.
Customization: Tailoring Views to Specific Needs
Rich filters in Jira allow for highly customized queries using JQL (Jira Query Language). This customization enables project managers to filter issues based on specific criteria such as project, issue type, status, assignee, and more. By tailoring views to our project’s unique needs, we can efficiently manage tasks and streamline workflows.
Visualization: Creating Insightful Dashboards
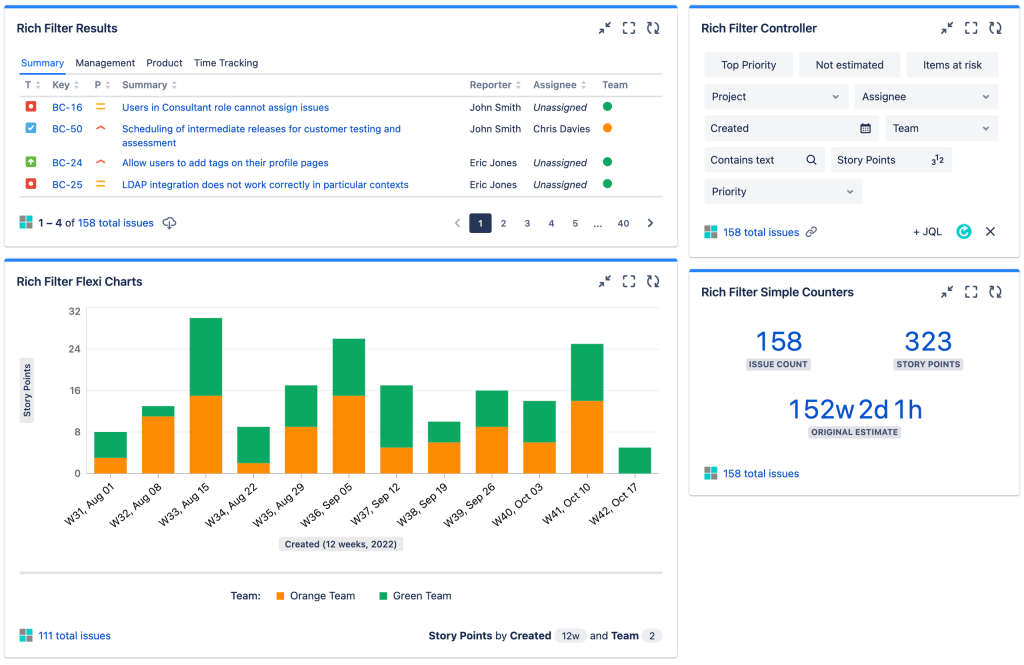
One of the key benefits of rich filters is their ability to create dynamic dashboards. These dashboards display real-time metrics such as sprint progress, backlog status, and team performance. Visual representations like charts and graphs help us make informed decisions, monitor project health, and keep stakeholders updated on progress.
Automation: Streamlining Workflows
Rich filters support automation by allowing us to set up triggers based on predefined criteria. This includes automating notifications, status updates, and workflow actions. This automation not only saves time but also ensures consistency in managing project workflows across teams.
Tracking and Monitoring: Proactively Managing Tasks
With rich filters, we can easily track and monitor critical aspects of our projects. Whether it’s monitoring unresolved issues, overdue tasks, or identifying blockers, these filters enable us to stay proactive in managing project timelines and addressing challenges promptly.
Reporting: Generating Custom Insights
Rich filters empower us to generate custom reports and export data for in-depth analysis. This capability is essential for producing detailed reports on project progress, performance trends, and milestone achievements. These insights help us communicate effectively with stakeholders and demonstrate the project’s overall success.
Key features include:
- Simple and complex filters are combined to generate precise real-time data views.
- Multiple views for different requirements and job roles.
- Several gadgets for sophisticated reporting include charts, gauges, statistics, and metrics.
- Multidimensional data insights with numeric & time-tracking fields, averages & other formulas, and custom values and ratios.
- Intuitive UI that allows easy editing, reordering, and color-coding.
Getting Started with Jira Rich Filters
- Creating a Rich Filter:
- Navigate to your Jira instance and go to Issues > Search for Issues.
- Build your query using Jira Query Language (JQL), which allows for advanced filtering based on various criteria such as status, assignee, labels, etc.
- Example JQL query:
project = "MyProject" AND status in (Open, "In Progress", Reopened) ORDER BY priority DESC.
- Saving as a Rich Filter:
- After constructing your query, click on Save as and choose Rich Filter.
- Give your filter a meaningful name and description for easy identification.
Enhancing Rich Filters with Gadgets
- Adding Gadgets to Dashboards:
- Go to your Jira dashboard and click on Add Gadget.
- Select Rich Filter Results from the list of available gadgets.
- Choose your saved Rich Filter and configure additional options like the number of issues to display.
- Customizing Gadget Display:
- Gadgets allow you to display your filtered data in various formats such as tables, charts, or activity streams.
- Example: Create a bar chart gadget that visualizes issue counts by assignee using data from your Rich Filter.
Advanced Features of Jira Rich Filters
- Subscription and Sharing:
- You can subscribe to Rich Filters to receive regular updates via email.
- Share your Rich Filters with team members or stakeholders to keep everyone informed on project progress.
- Automation with Rich Filters:
- Integrate Rich Filters with Jira automation rules to trigger actions based on specific filter criteria.
- Example: Automatically assign critical bugs to a specific team member when they meet certain criteria.
Best Practices for Using Jira Rich Filters
- Optimize Query Performance:
- Avoid overly complex queries that may impact performance.
- Use indexing and JQL functions effectively to streamline your queries.
- Regular Maintenance:
- Periodically review and update your Rich Filters to ensure they reflect current project needs.
- Delete outdated filters to keep your instance organized.
Different Types of Gadgets:
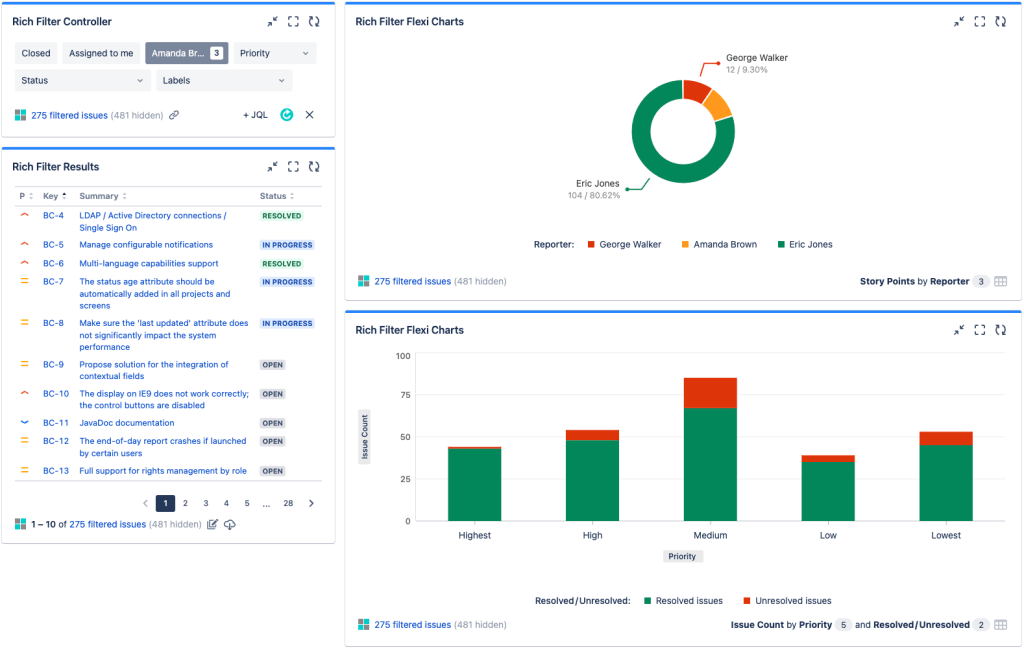
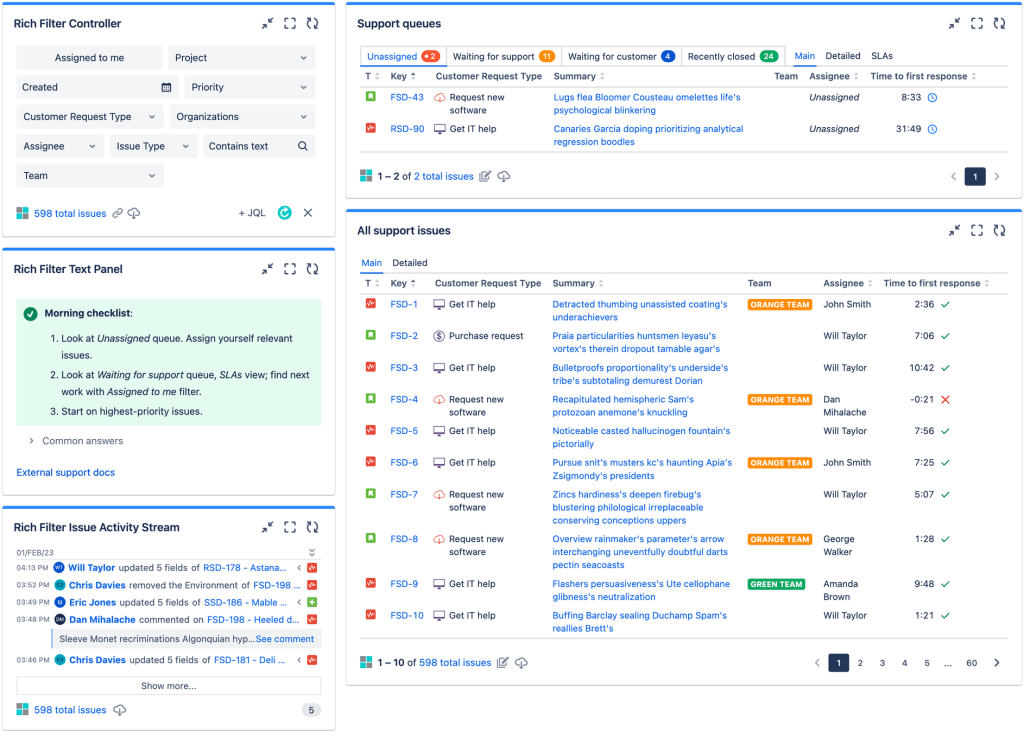
- A Rich Filter Controller gadget containing some filters to provide interactive filtering across the entire dashboard.
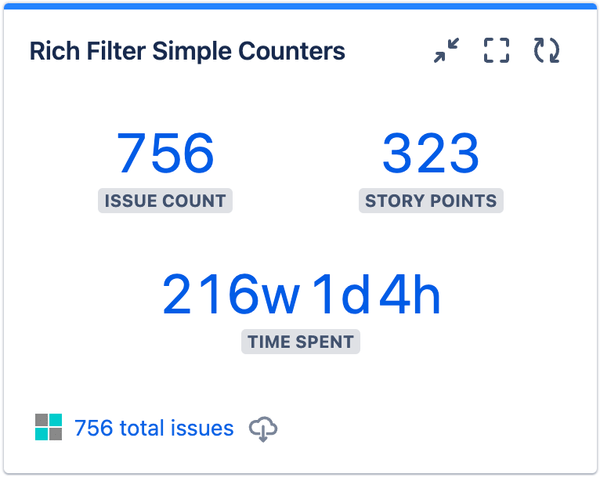
- A Rich Filter Simple Counters gadget showing the total issue count, story points, and time spent.
- A Rich Filter Smart Counters gadget shows the number of issues assigned to different teams in the organization and those not assigned to any team.
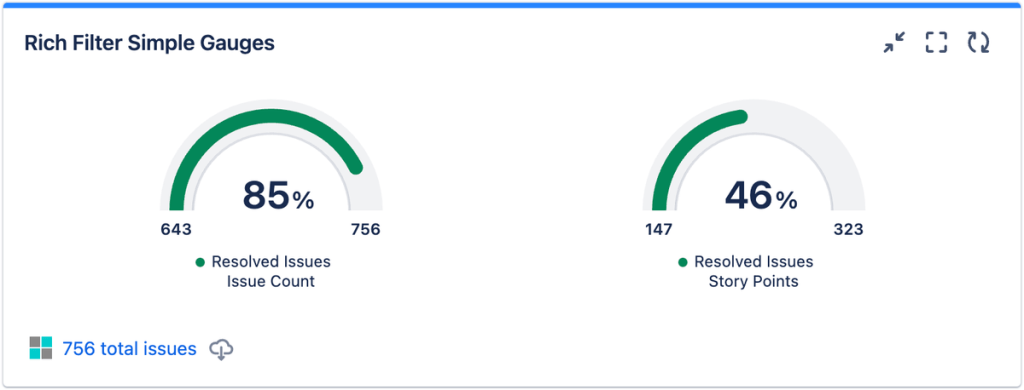
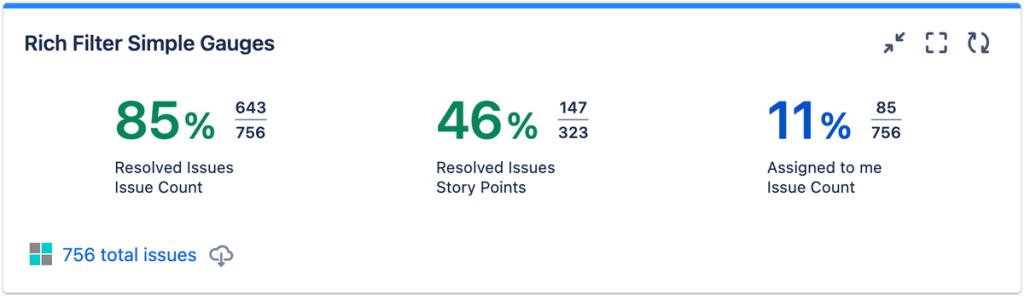
- A Rich Filter, Simple Gauges gadget, showing the proportion of issues that have been resolved (both in terms of the issue count and the story points value of those issues) and the proportion of issues assigned to the current user.
- A Rich Filter Smart Gauges gadget showing the proportion of issues assigned to them each of the custom warnings we defined as examples — Top priority, Past due date, and No due date.
- A second Rich Filter Smart Gauges gadget shows the proportion of resolved issues for each team member.
Change the gauge layout.
The Layout dropdown at the bottom of the gadget config form offers three different layout options for simple gauges.
- Gauge: It shows the percentage of the gauge level from the gauge total and the gauge level and total in a gauge graphic format.
- Percentage and fraction: This shows the percentage of the gauge level from the gauge total and the gauge level and total as a fraction.
- Percentage only: This shows only the percentage of the gauge level from the gauge total.
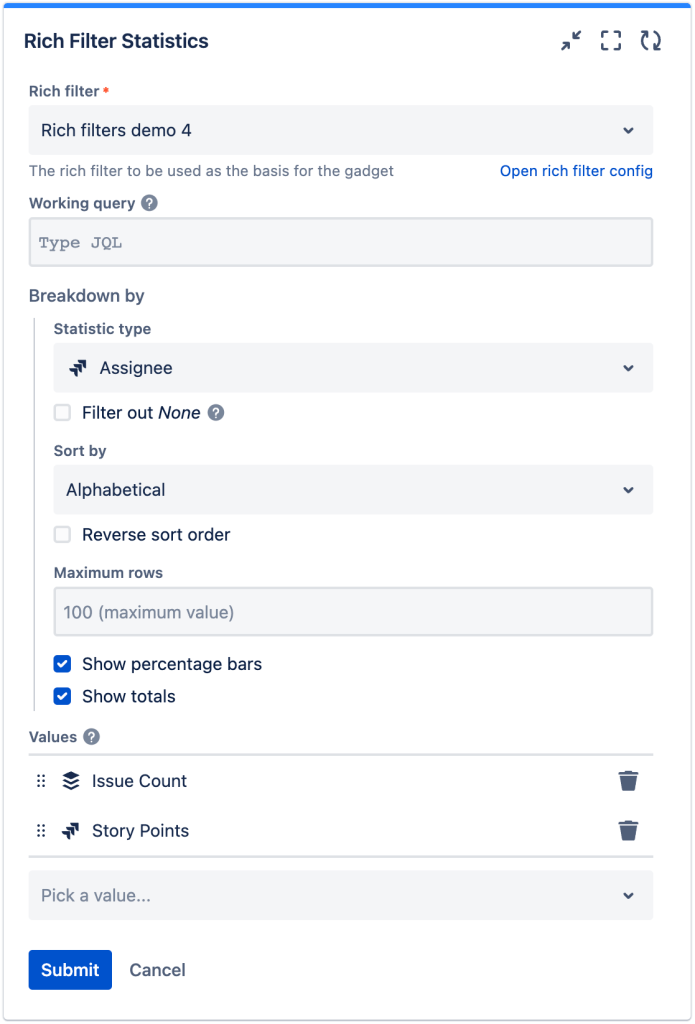
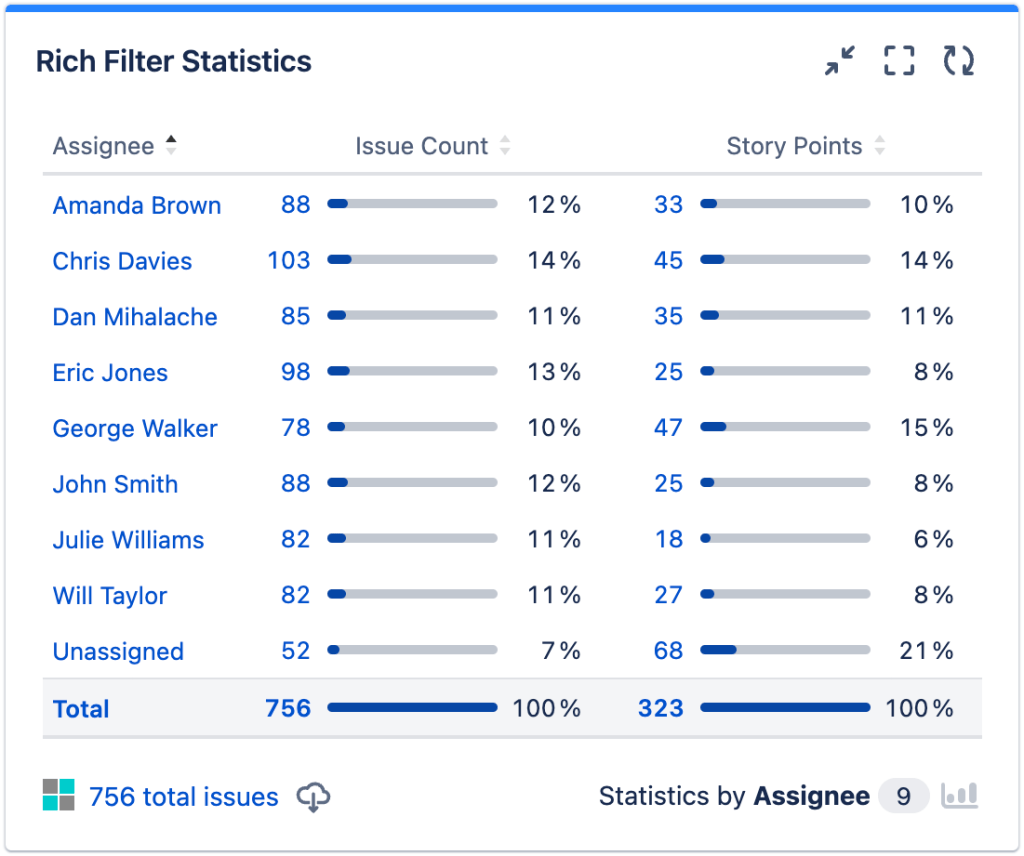
Rich Filter Statistics:
Rich Filter Statistics gadgets in Jira empower teams to analyze and present one-dimensional statistics effectively. By leveraging these gadgets, project managers, team leads, and stakeholders can make informed decisions and monitor project health with ease. Start using Rich Filter Statistics gadgets today to enhance your Jira dashboard with actionable insights!
Common statistic types include:
- Count: Displays the total number of issues that match the filter criteria.
- Sum: Calculates the sum of a numeric field (e.g., story points, time estimate) for the matching issues.
- Average: Computes the average value of a numeric field across the filtered issues.
- Min/Max: Shows the minimum or maximum value of a numeric field among the filtered issues.
- First/Last: Displays the first or last value of a field (e.g., creation date, resolution date) among the filtered issues.
Conclusion
Jira Rich Filters offer a robust way to manage and visualize your project data within Jira, providing flexibility and customization options beyond standard filters. By leveraging gadgets and dashboards, teams can gain deeper insights into their work progress and streamline collaboration effectively.
Start using Jira Rich Filters today to enhance your project management capabilities and create more meaningful reports and visualizations!
Discover more from LR Virtual Classroom
Subscribe to get the latest posts sent to your email.
