As the saying goes ” Anything that cannot be measured, cannot be managed well”.
Though there are wide range of metrics being measured during Agile Project Management, listed few down which I feel is important to track in any projects.
- It’s important to have your KPI’s be –
- Specific
- Measurable
- Attainable
- Relevant
- Time bound
| Metrics | Goal | Objective | Formula | Unit of Metric |
| Sprint Velocity | Improve Productivity | To find out the average number of features turned into product increment during a particular sprint. | Sum up of the story points for all completed User Stories | Story points |
| Team Velocity | Improves forecasting | To find how many user stories were completed by the team, on average. | Sum of all story points completed across sprints / Total number of sprints | Story Points |
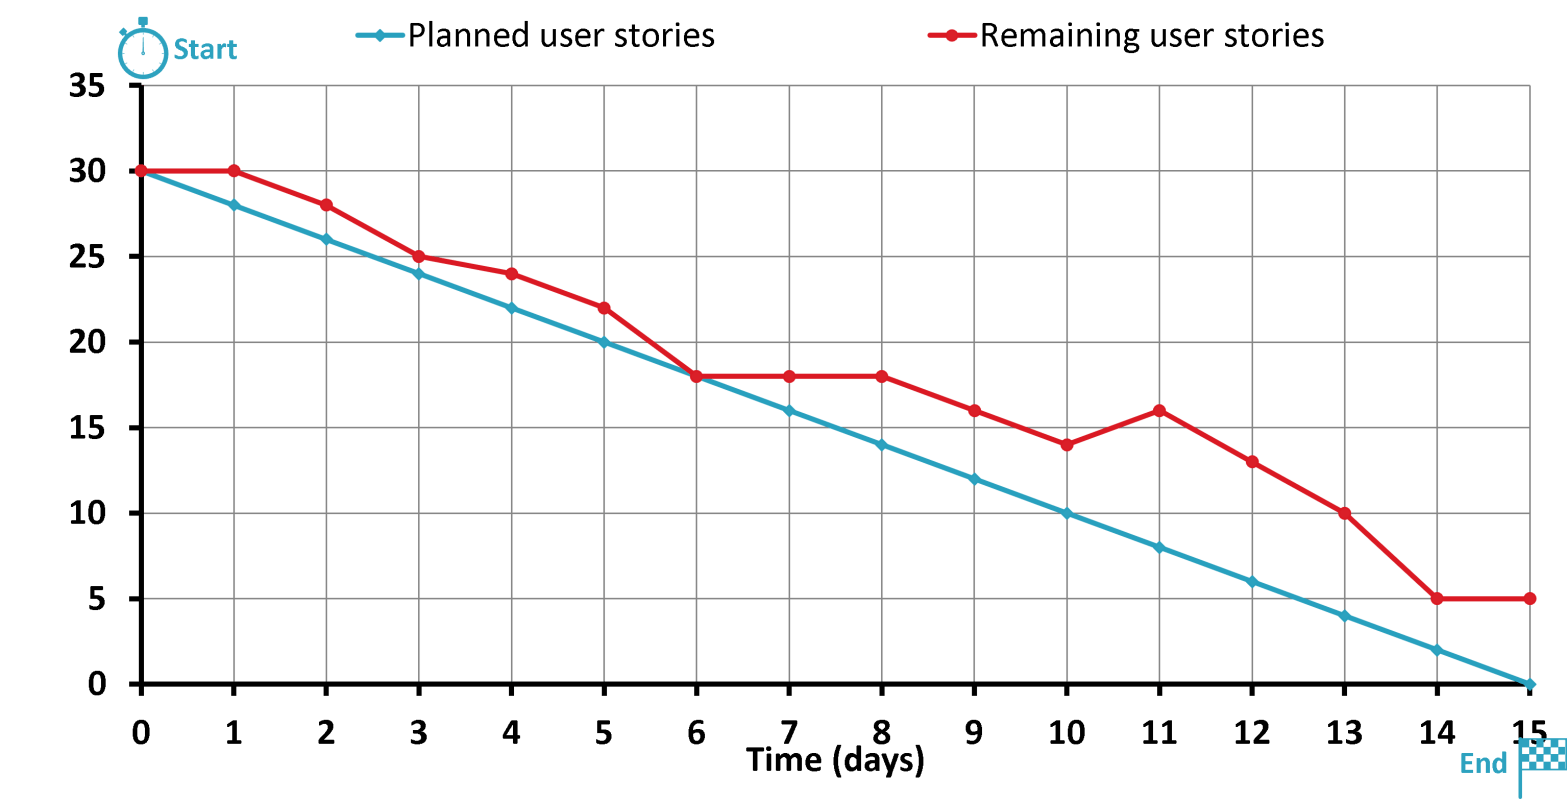
| Sprint Burndown | Measure progress of a sprint | To show the number of hours / story points remaining to complete the features planned for the current sprint for each day during the sprint | Graphical representation of remaining story points at end of each day of the sprint (work committed vs. work completed) | Story points |
| Efforts Variance (%) | Improve delivery capability | To ensure you have planned the work for the total capacity of the resources. | (Planned capacity / Total available capacity) *100 | % |
| % Resource Utilization | Resource Productivity | To ensure the resources are fully utilized. Include the time-off. | Total Billable hrs / Total Available hrs * 100 | % |
| Defect Review Efficiency | Improve delivery quality | To control and monitor the efficiency of review process. | Total number of review defects / (Total number of review defects + Total number of testing defects) * 100 | % |
| Defect Leakage | Improve delivery quality | To monitor the effectiveness of testing process in terms defects that are left undetected by the team. | (Total No. of Defects in UAT/ Total No. of Defects before UAT) x 100 | % |
| Cause – wise Defect Distribution | Improve delivery quality | To see the trend of defect distribution in different causes. This will help in defect prevention. | Number of defects due to particular cause /Total number of detects found | % |
| Client Satisfaction Index | Improve client satisfaction ratings | This will help in determining the satisfaction level of the client | Average CSAT Rating based on various parameters | Scale of 10 |
Discover more from LR Virtual Classroom
Subscribe to get the latest posts sent to your email.
