Recently came across the keyword S-curve. Though familiar, out of relearning the concept, sharing the learnings about the S-curve is the most important representation in Project Management.
It is commonly used to track the progress in terms of budget and check if it stays on schedule.
The S-curve is a graphical representation tool that can display cumulative data over time (such as project cost, quantity, work hours, and progress).
It is usually the plot of two data sets against time.
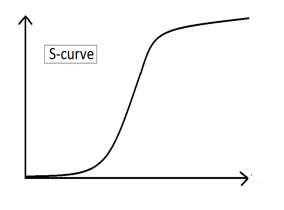
S-Curve
The term S-curve represents the tendency of the cumulative data to form a shallow “S” shape curve; it is flat at the beginning, steeper in the middle, and flattened at the end.
The s-curve in a graph is shaped like an “S”, but don’t be surprised if your s-curve isn’t in the shape of an “S”. There are several S-curve shapes, depending on the nature of the project.
The shape of the S-curve will vary if plotted for different scenarios like
- Performance
- Inventions
- Profitability
Different stages in S-Curve:
There are four stages in S-Curve:
- Prototype
- Growth
- Maturity
- Decline
1. In the early stages, the project starts to disintegrate and team members are just starting to get involved in the first phase of the project. This is the PROTOTYPE phase.
2. As more and more progress is made, the growth suddenly begins to accelerate. If you want that rapid growth in the graph, this is the middle part of the ‘S’. These are the most important parts of the curve because this is the place where growth is stagnating. This is called the GROWTH phase.
The maximum growth point is called the inflection point.
At this stage, the team members generally work quite heavily on the project tasks, complete major milestones and so the cost increases.
3. The s-curve is a shape that looks like a mountain after crossing the point of inflection, the curve begins to wind down. Essentially, this is the maturity stage of the project.
4.Generally, when the process crosses this point, only minor tasks are pending and are progressing towards the closure stage. This is called the DECLINE phase.

Let’s take a real time example to understand:
Kumar is the sales manager for a small product company that sells new type of smartphone.
He has noticed that orders are starting to slow down after many months of heavy demand.
He constantly plotted the planned vs actual sales over time.
Based on an S-curve analysis, he released that the company has reached market saturation.
It is high time that he needs to stop the production in order to avoid the ample production and waste.
Different Types of S-Curve:
There are many several types of S-curves such as 1) man-hours vs. time 2) cost vs. time.
For example, S-curve can be used to plot the below details.
- Planned vs Actual Baseline S-curve
- S curve in terms of %
- Recovery plan and actual
- Cash flow-planned vs Forecast vs Actual
- Comparison of Quantity or progress
- Current vs future Sales
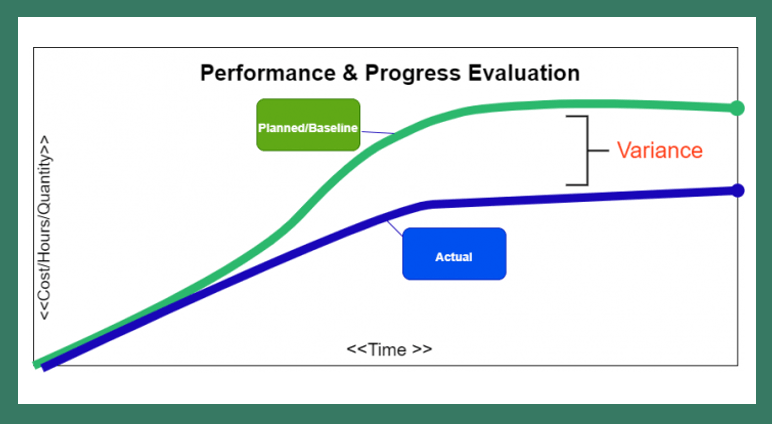
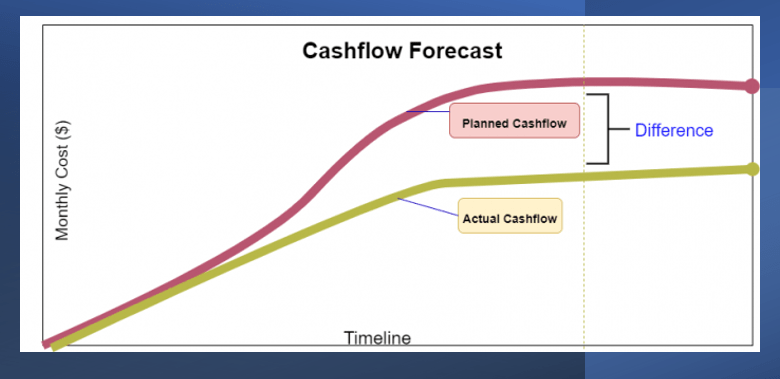
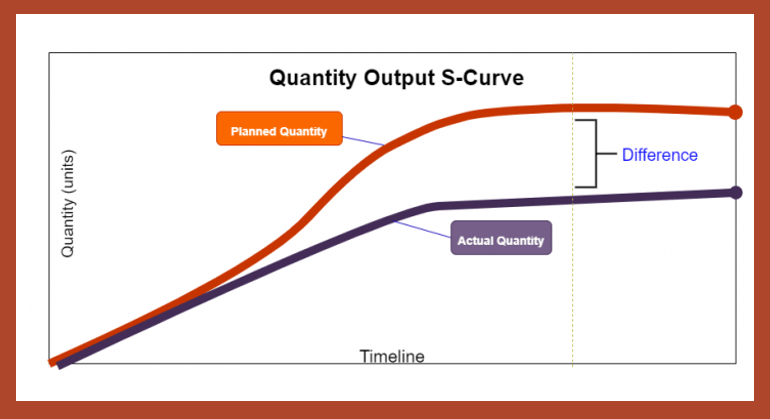
The below images are taken from the source: https://www.ntaskmanager.com/blog/s-curve-in-project-management/
Model of S-Curve:
There are two commonly noticed models in S-curve. they are front loaded and back loaded S-curves.
Front Loaded – indicates that more money and resources will be consumed early in the project. For example, Repetitive projects that need little preparation time and planning or projects which need urgent repair or fix of the issues. will often be front loaded.
Back Loaded – indicates that more tasks, money and resources will be consumed later in the project.
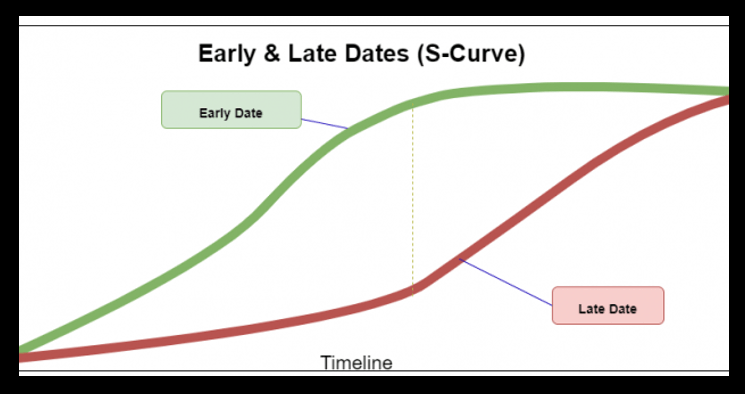
Banana shaped – indicated that the possibilities when we can expect the project to be completed on time. For example, early date vs late date. It generally overlaps at the beginning and end of the curve, thus forming the banana shaped.
Benefits of the S-curve
While there are many benefits in plotting the S-curve, the core purpose is
- Helps track the project
- Helps make the forecast
- Helps to take proactive or corrective actions.
Thus, right from understanding what is S-Curve, its usage, different types and model of S-curve, we finally understood the benefits of S-curve.
Discover more from LR Virtual Classroom
Subscribe to get the latest posts sent to your email.
